NIST IR 6483 日本語訳
英語タイトル : Randomness Testing of the Advanced Encryption Standard Finalist Candidates日本語タイトル : 次世代暗号標準(Advanced Encryption Standard)最終候補のランダムネス検定
公開日 : 2000-04-01
原文URL : https://csrc.nist.gov/pubs/ir/6483/final
翻訳編集 : 自動生成(有志による非公式の日本語訳), 原文取得日 : 2026-10-31, 訳文 : 133 / 133 ブロック
[要約] NIST IR 6483 は、次世代暗号標準(AES)の最終候補に選ばれた Mars、RC6、Rijndael、Serpent、Twofish のランダムネス検定について、NIST が実施した研究を報告したものです。検定は、192 ビットと 256 ビットの鍵長を全ラウンドで、128 ビットの鍵長を部分ラウンドで検討する形で行い、NIST の統計的検定スイートを用いています。このスイートは 16 の中核となる統計的検定から成り、パラメータ入力を変えると 189 の統計的検定と見なせるとしています。結果として、Serpent の 1 つのケースに統計的な異常があったものの、すべてのアルゴリズムはランダムネスからの検出可能な逸脱がないように見えると述べています。
NISTIR 6483
NISTIR 6483
Randomness Testing of the Advanced Encryption Standard Finalist Candidates
次世代暗号標準(Advanced Encryption Standard)最終候補のランダムネス検定
Juan Soto Lawrence Bassham U.S. DEPARTMENT OF COMMERCE Technology Administration Computer Security Division National Institute of Standards and Technology Gaithersburg, MD 20899
Juan Soto Lawrence Bassham 米国商務省 技術管理局 コンピュータセキュリティ部門 国立標準技術研究所 Gaithersburg, MD 20899
April 2000
2000年4月
U.S. DEPARTMENT OF COMMERCE William M. Daley, Secretary TECHNOLOGY ADMINISTRATION Dr. Cheryl L. Shavers, Under Secretary of Commerce for Technology NATIONAL INSTITUTE OF STANDARDS AND TECHNOLOGY Raymond G. Kammer, Director
米国商務省 William M. Daley 長官 技術管理局 Dr. Cheryl L. Shavers、商務次官(技術担当) 国立標準技術研究所 Raymond G. Kammer、所長
Randomness Testing of the Advanced Encryption Standard Finalist Candidates1
次世代暗号標準(Advanced Encryption Standard)最終候補のランダムネス検定1
Juan Soto and Lawrence Bassham Computer Security Division National Institute of Standards and Technology 100 Bureau Drive, Stop 8930 Gaithersburg, MD 20899-8930 Email: soto@nist.gov, lbassham@nist.gov
Juan Soto と Lawrence Bassham コンピュータセキュリティ部門 国立標準技術研究所 100 Bureau Drive, Stop 8930 Gaithersburg, MD 20899-8930 Email: soto@nist.gov, lbassham@nist.gov
March 28, 2000
2000年3月28日
Abstract. Mars, RC6, Rijndael, Serpent and Twofish were selected as finalists for the Advanced Encryption Standard (AES). To evaluate the finalists’ suitability as random number generators, empirical statistical testing is commonly employed. Although it widely believed that these five algorithms are indeed random, randomness testing was conducted to show that there is empirical evidence supporting this belief. In this paper, NIST reports on the studies that were conducted on the finalists for the 192-bit key size and 256-bit key size. The results to date suggest that all five of the finalists appear to be random.
概要。Mars、RC6、Rijndael、Serpent、Twofish が、高度暗号化標準(AES)の最終候補に選ばれました。最終候補が乱数生成器として適しているかどうかを評価するため、経験的な統計的検定が一般に用いられます。これら 5 つのアルゴリズムは実際にランダムであると広く信じられていますが、この信念を裏付ける経験的な証拠があることを示すために、ランダムネス検定を実施しました。本稿では、NIST が、192 ビット鍵長と 256 ビット鍵長について最終候補に対して実施した研究を報告します。現時点までの結果は、5 つの最終候補すべてがランダムであるように見えることを示唆しています。
1 Introduction
1 はじめに
During the Advanced Encryption Standard (AES) Round 1 analysis period, NIST conducted randomness tests focusing strictly on the 128-bit keysize case and reported on each of the fifteen candidate algorithms being considered for the standard [3]. On August 9, 1999, five encryption algorithms (i.e., Mars, RC6, Rijndael, Serpent and Twofish) were selected as finalist candidates for the AES.
次世代暗号標準(AES)の第 1 ラウンドの分析期間中、NIST は 128 ビット鍵長の場合のみに絞ってランダムネス検定を実施し、標準として検討されていた 15 の候補アルゴリズムのそれぞれについて報告しました [3]。1999年8月9日に、5 つの暗号アルゴリズム(Mars、RC6、Rijndael、Serpent、Twofish)が AES の最終候補として選ばれました。
During the AES Round 2 analysis period, NIST further evaluated the suitability of the five finalists as random number generators, focusing on the 192-bit and 256-bit keysize (under full round2 considerations) and the 128-bit keysize (under partial round3 considerations). As time permits, additional randomness testing efforts will be conducted.
AES の第 2 ラウンドの分析期間中、NIST は、5 つの最終候補が乱数生成器として適しているかどうかをさらに評価しました。その際、192 ビットと 256 ビットの鍵長(全ラウンド2での検討)と、128 ビットの鍵長(部分ラウンド3での検討)に焦点を当てました。時間が許せば、追加のランダムネス検定を実施します。
This paper describes how the output for each of the finalist algorithms was collected and then evaluated for randomness. It discusses what was learned utilizing the NIST statistical tests [2] and offers an interpretation of the empirical results. In Section 2, the Randomness Testing Experimental Setup is defined and described. In Sections 3 and 4, the Full Round Testing and Partial Round Testing efforts are discussed, respectively. Lastly, in Section 5, Summary and Conclusion, a final interpretation of the test results is drawn.
本稿は、最終候補の各アルゴリズムの出力をどのように収集し、ランダムネスについて評価したかを説明します。NIST の統計的検定 [2] を利用して分かったことを論じ、経験的な結果の解釈を示します。第 2 節では、ランダムネス検定の実験設定を定義し説明します。第 3 節と第 4 節では、それぞれ全ラウンド検定と部分ラウンド検定の取り組みを論じます。最後に、第 5 節のまとめと結論で、検定結果の最終的な解釈を示します。
2 Randomness Testing Experimental Setup
2 ランダムネス検定の実験設定
Randomness testing activities can be divided into two parts. NIST analyzed the output for each of the five algorithms under full round and partial round considerations. All randomness testing was based on the application of the NIST Statistical Test Suite. This suite consists of 16 core statistical tests that, under different parameter inputs, can be viewed as 189 statistical tests. Table 1 lists each of the core statistical tests, followed by the number of P-values4 reported by each core test and the test identifier. Each P-value corresponds to the application of an individual statistical test on a single binary sequence. For a brief description of each of these tests, see Appendix A. Full details documenting the derivation and description of the tests may be found in a forthcoming NIST publication [2].
ランダムネス検定の作業は 2 つの部分に分けられます。NIST は、5 つのアルゴリズムそれぞれの出力を、全ラウンドと部分ラウンドの考慮の下で分析しました。すべてのランダムネス検定は、NIST の統計的検定スイートの適用に基づいています。このスイートは 16 の中核となる統計的検定から成り、パラメータ入力を変えると 189 の統計的検定と見なすことができます。表 1 は、中核となる各統計的検定を示し、続けて、各中核検定が報告する P 値4の数と検定の識別子を示しています。各 P 値は、単一の 2 値系列に対する個々の統計的検定の適用に対応します。これらの検定それぞれの簡単な説明は、付録 A を参照してください。検定の導出と説明を記録した詳細は、近く刊行される NIST の刊行物 [2] に記載されています。
| Statistical Test | No. of P-values | Test ID | Statistical Test | No. of P-values | Test ID |
|---|---|---|---|---|---|
| Monobit | 1 | 1 | Periodic Template | 1 | 157 |
| Block Frequency | 1 | 2 | Universal Statistical | 1 | 158 |
| Cusum | 2 | 3-4 | Approximate Entropy | 1 | 159 |
| Runs | 1 | 5 | Random Excursions | 8 | 160-167 |
| Long Runs of Ones | 1 | 6 | Random Excursions Variant | 18 | 168-185 |
| Rank | 1 | 7 | Serial | 2 | 186-187 |
| Spectral DFT | 1 | 8 | Lempel-Ziv Compression | 1 | 188 |
| Aperiodic Templates | 148 | 9-156 | Linear Complexity | 1 | 189 |
| 統計的検定 | P 値の数 | 検定 ID | 統計的検定 | P 値の数 | 検定 ID |
|---|---|---|---|---|---|
| Monobit | 1 | 1 | Periodic Template | 1 | 157 |
| Block Frequency | 1 | 2 | Universal Statistical | 1 | 158 |
| Cusum | 2 | 3-4 | Approximate Entropy | 1 | 159 |
| Runs | 1 | 5 | Random Excursions | 8 | 160-167 |
| Long Runs of Ones | 1 | 6 | Random Excursions Variant | 18 | 168-185 |
| Rank | 1 | 7 | Serial | 2 | 186-187 |
| Spectral DFT | 1 | 8 | Lempel-Ziv Compression | 1 | 188 |
| Aperiodic Templates | 148 | 9-156 | Linear Complexity | 1 | 189 |
Table 1. Breakdown of the 189 statistical tests applied during experimentation
表 1. 実験中に適用した 189 の統計的検定の内訳
Randomness testing was performed using the following strategy:
ランダムネス検定は、次の方針で実施しました。
(a) Input parameters such as the sequence length, sample size, and significance level5 were fixed for each sample6. These parameters were set at \(2^{20}\) bits, 300 binary sequences, and 0.01, respectively. For each binary sequence and each statistical test, a P-value was reported.
(a) 系列長、標本サイズ、有意水準5などの入力パラメータは、各標本6について固定しました。これらのパラメータは、それぞれ \(2^{20}\) ビット、300 個の 2 値系列、0.01 に設定しました。各 2 値系列と各統計的検定について、P 値が報告されました。
(b) For each P-value, a success/failure assessment was made based on whether or not it exceeded or fell below the pre-selected significance level.
(b) 各 P 値について、あらかじめ選んだ有意水準を上回ったか下回ったかに基づいて、成功・失敗の評価を行いました。
(c) For each statistical test and each sample, two evaluations were made. First, the proportion of binary sequences in a sample that passed the statistical test was calculated. The P-value for this proportion is equal to the probability of observing a value equal to or greater than the calculated proportion. Second, an additional P-value was calculated, based on a \(\chi^2\) test (with nine degrees of freedom) applied to the P-values in the entire sample to ensure uniformity.
(c) 各統計的検定と各標本について、2 つの評価を行いました。第 1 に、標本の中で統計的検定に合格した 2 値系列の割合を計算しました。この割合に対する P 値は、計算された割合以上の値が観測される確率に等しくなります。第 2 に、標本全体の P 値に自由度 9 の \(\chi^2\) 検定を適用して、一様性を確認するための追加の P 値を計算しました。
(d) For both measures described in step (c), an assessment was made. A sample was considered to have passed a statistical test if it satisfied both the proportion and uniformity assessments. If either of the two P-values in step (c) fell below 0.0001, then the sample was flagged as suspect7. If this occurred, additional samples were evaluated. Otherwise, the sample was believed to have satisfied the criterion for being random (from the point of view of a specific statistical test).
(d) 手順 (c) で述べた 2 つの尺度の両方について、評価を行いました。標本は、割合と一様性の両方の評価を満たした場合に、統計的検定に合格したと見なしました。手順 (c) の 2 つの P 値のいずれかが 0.0001 を下回った場合、その標本は疑わしいもの7として印を付けました。そのような場合には、追加の標本を評価しました。そうでなければ、その標本は(特定の統計的検定の観点から)ランダムであるための基準を満たしたものと見なしました。
3 Full Round Testing (FRT)
3 全ラウンド検定(FRT)
FRT activities were conducted over a period of several months on multiple SUN Ultra8 workstations. All data was generated and evaluated online. Only the data used as the plaintext and the 192-bit and 256-bit keys were stored offline. These values were based on data generated using the Blum-Blum-Shub (BBS) pseudorandom bit generator9. All 189 statistical tests were applied to each data set as described in Appendix B.
FRT の作業は、複数の SUN Ultra8 ワークステーション上で数か月にわたって実施しました。すべてのデータは、オンラインで生成および評価されました。平文として用いたデータと、192 ビットおよび 256 ビットの鍵だけが、オフラインで保存されました。これらの値は、Blum-Blum-Shub(BBS)擬似ランダムビット生成器9を用いて生成されたデータに基づいています。189 のすべての統計的検定が、付録 B に述べるとおり、各データセットに適用されました。
3.1 Data Description
3.1 データの説明
NIST harnessed and analyzed eight data types for each of the two keysizes (i.e., 192 and 256 bits) for each of the algorithms, for a total of 80 different data sets10. These data sets were selected based on the belief that they would be useful in evaluating the randomness of cryptographic algorithms. Table 2 lists the eight data types. For a description of the data types, see Appendix B.
NIST は、各アルゴリズムについて、2 つの鍵長(すなわち 192 ビットと 256 ビット)のそれぞれで 8 種類のデータを取り込んで分析し、合計 80 の異なるデータセットを得ました10。これらのデータセットは、暗号アルゴリズムのランダムネス評価に役立つと考えられるものとして選ばれました。表 2 に 8 種類のデータを示します。データ種別の説明は、付録 B を参照してください。
| Key Avalanche |
| Plaintext Avalanche |
| Plaintext/Ciphertext Correlation |
| Cipher Block Chaining Mode |
| Low Density Plaintext |
| Low Density Keys |
| High Density Plaintext |
| High Density Keys |
| 鍵アバランシェ |
| 平文アバランシェ |
| 平文/暗号文相関 |
| 暗号ブロック連鎖モード |
| 低密度平文 |
| 低密度鍵 |
| 高密度平文 |
| 高密度鍵 |
Table 2. Data types
表 2. データ種別
3.2 Empirical Results & Analysis
3.2 経験的な結果と分析
The application of the aperiodic template11 statistical test on Serpent’s Plaintext/Ciphertext Correlation (based on 256-bit keys) yielded 12 rejections out of a sample of 300 binary sequences. According to the probability table in Appendix C, the P-value of such an event is 0.0000629219.
Serpent の Plaintext/Ciphertext Correlation(256 ビット鍵に基づく)に非周期テンプレート11の統計的検定を適用したところ、300 個の 2 値系列の標本のうち 12 個が棄却されました。付録 C の確率表によれば、このような事象の P 値は 0.0000629219 です。
Subsequent experiments were conducted for this particular case. In all, a total of 1,167,600 binary sequences were evaluated. This constituted 3,892 repetitions of the original experiment. In no other instance did such an event occur. Therefore, the 12 rejections obtained from the original experiment could be considered as an anomaly. If the 3,892 samples were collectively viewed as a single data set, the resulting number of rejections was 11,758, a number well within acceptable limits (i.e., the ideal number of rejections would be 11,676).
この特定のケースについて、追加の実験を実施しました。合計で 1,167,600 個の 2 値系列を評価しました。これは、元の実験を 3,892 回繰り返したことに相当します。このような事象が起きたケースは、ほかにはありませんでした。したがって、元の実験で得られた 12 個の棄却は、異常値と見なせます。3,892 個の標本を全体として 1 つのデータセットと見なした場合、棄却の数は 11,758 であり、許容範囲内に十分収まる数でした(すなわち、棄却の理想的な数は 11,676 です)。
4 Partial Round Testing (PRT)
4 部分ラウンド検定(PRT)
Partial round testing activities were conducted over a period of several months on several SUN Ultra workstations. All data was generated and evaluated online. However, due to resource constraints, partial round testing was limited to the low-density plaintext case using 128-bit BBS generated keys. As in FRT, all 189 statistical tests were applied to each (round-by-round) data set.
部分ラウンド検定の作業は、複数の SUN Ultra ワークステーション上で数か月にわたって実施しました。すべてのデータは、オンラインで生成および評価されました。ただし、資源の制約のため、部分ラウンド検定は、BBS で生成した 128 ビットの鍵を使う低密度平文のケースに限定しました。FRT と同様に、189 のすべての統計的検定を、(ラウンドごとの)各データセットに適用しました。
4.1 Data Description
4.1 データの説明
Testing was conducted on partial round versions of the algorithms under 128-bit keys. Each data set consisted of the low-density plaintexts described in Table 2 and Appendix B. Each data set was encrypted under a distinct, randomly chosen key. For each algorithm, the round outputs were evaluated against all of the applicable tests. Table 3 lists the earliest round for each algorithm at which the outputs appeared to be random in all of the tests. As one might expect, the outputs of all subsequent rounds also appeared to be random.
検定は、128 ビット鍵の下でのアルゴリズムの部分ラウンド版に対して実施しました。各データセットは、表 2 と付録 B に述べた低密度平文で構成されていました。各データセットは、それぞれ異なるランダムに選んだ鍵で暗号化しました。各アルゴリズムについて、ラウンドの出力を、適用可能なすべての検定に照らして評価しました。表 3 は、各アルゴリズムについて、すべての検定で出力がランダムに見えた最初のラウンドを示しています。予想されるとおり、それ以降のすべてのラウンドの出力もランダムに見えました。
There were a few issues to address in defining partial round versions of the algorithms. If input whitening was prescribed (MARS, RC6, Rijndael, Twofish), then it was left intact; however, output whitening (MARS, RC6, Twofish) was omitted. In fact, the outputs of the final rounds for the algorithms were not considered at all, because full round testing was previously conducted for low-density plaintexts under 128-bit keys during AES Round 1 analysis. Subkeys were applied in their original order, as were rounds, so that if a modified final round was prescribed (Rijndael, Serpent), then it was never used.
アルゴリズムの部分ラウンド版を定義するうえで、対処すべき問題がいくつかありました。入力ホワイトニングが規定されている場合(MARS、RC6、Rijndael、Twofish)はそのまま残しましたが、出力ホワイトニング(MARS、RC6、Twofish)は省略しました。実際、最終ラウンドの出力は、AES の第 1 ラウンドの分析期間中に、128 ビット鍵の下での低密度平文について全ラウンド検定がすでに実施されていたため、まったく考慮しませんでした。サブ鍵は、ラウンドと同様に元の順序で適用したため、変更された最終ラウンドが規定されている場合(Rijndael、Serpent)、それは一度も使われませんでした。
Thus, the round outputs of RC6 were evaluated from rounds 1 to 19; Rijndael, from rounds 1 to 9; and Serpent, from rounds 1 to 31. For technical reasons, Twofish rounds were evaluated in pairs12, namely, the even numbered rounds from 2 to 14. MARS has a heterogeneous structure, so three different partial round versions were defined. First, the 8 preliminary, unkeyed, “forward mixing” rounds were left intact, and the outputs of each of the 16 keyed, “core” rounds were evaluated. Second, the forward mixing was disabled, and the outputs of the 16 core rounds were evaluated. Third, the outputs of the 8 forward mixing rounds were evaluated.
したがって、RC6 のラウンド出力はラウンド 1 から 19 まで、Rijndael はラウンド 1 から 9 まで、Serpent はラウンド 1 から 31 までを評価しました。技術的な理由により、Twofish のラウンドは 2 つ 1 組12、すなわち 2 から 14 までの偶数番号のラウンドで評価しました。MARS は不均質な構造を持つため、3 種類の異なる部分ラウンド版を定義しました。第 1 に、鍵を使わない予備の 8 ラウンドの「前方混合」はそのまま残し、鍵を使う 16 の「中核」ラウンドそれぞれの出力を評価しました。第 2 に、前方混合を無効にして、16 の中核ラウンドの出力を評価しました。第 3 に、8 ラウンドの前方混合の出力を評価しました。
4.2 Empirical Results & Analysis
4.2 経験的な結果と分析
Sections 4.2.1 through 4.2.5 depict the PRT results, illustrated up to the fourth round for each algorithm, with the exception of Twofish, which is illustrated up to the eighth round. In each figure, the solid line at 99% depicts the expected proportion (i.e., 3 binary sequences rejected out of 300), whereas, the dashed line at 96.33% depicts the smallest proportion that satisfies the 0.0001 acceptance criterion (i.e., 11 binary sequences rejected out of 300). Proportions smaller than 96.33% correspond to events that are considered to be unlikely. Thus, if a proportion fell below 96.33%, it was flagged and subjected to additional statistical testing. See Appendix C for additional information.
4.2.1 節から 4.2.5 節では、各アルゴリズムについて第 4 ラウンドまで(Twofish のみ第 8 ラウンドまで)を図示した PRT の結果を示します。各図で、99% の実線は期待される割合(すなわち、300 個の 2 値系列のうち 3 個が棄却される場合)を表し、96.33% の破線は、0.0001 の受容基準を満たす最小の割合(すなわち、300 個の 2 値系列のうち 11 個が棄却される場合)を表します。96.33% より小さい割合は、起こりそうにないと見なされる事象に対応します。したがって、割合が 96.33% を下回った場合は、印を付けて追加の統計的検定の対象としました。詳細は付録 C を参照してください。
| Finalist | Round where randomness is evident13 | Finalists | Round where randomness is evident |
|---|---|---|---|
| Mars14 | 1 | RC6 | 4 |
| Mars15 | 4 | Rijndael | 3 |
| Mars16 | 6 | Serpent | 4 |
| Twofish | 2 |
| 最終候補 | ランダムネスが明らかになるラウンド13 | 最終候補 | ランダムネスが明らかになるラウンド |
|---|---|---|---|
| Mars14 | 1 | RC6 | 4 |
| Mars15 | 4 | Rijndael | 3 |
| Mars16 | 6 | Serpent | 4 |
| Twofish | 2 |
Table 4. The earliest round for each algorithm at which the outputs appear to be random.
表 4。各アルゴリズムについて、出力がランダムに見える最初のラウンド。
4.2.1 Mars Algorithm17
4.2.1 Mars アルゴリズム17
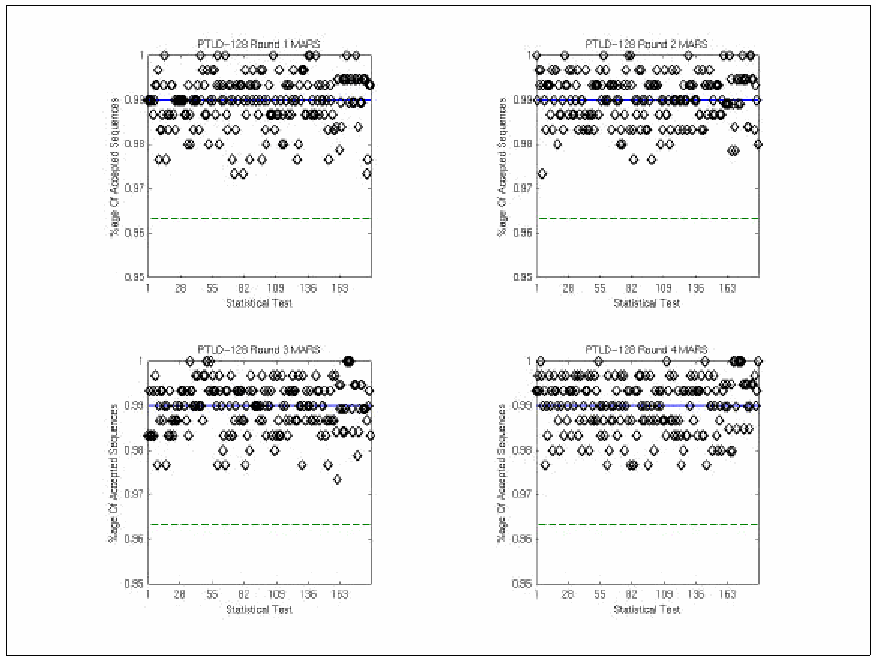
2行2列に並んだ4つの散布図です。題は「PTLD-128 Round 1 MARS」、「PTLD-128 Round 2 MARS」、「PTLD-128 Round 3 MARS」、「PTLD-128 Round 4 MARS」です。各図は、189の統計検定について、縦軸に受理された系列の割合(%age Of Accepted Sequences)、横軸に統計検定の番号(Statistical Test、目盛り 1、28、55、82、109、136、163)をとり、0.99 の実線(期待される割合)と約 0.9633 の破線(受容閾値)を示します。4つのラウンドとも、ほとんどの点が約 0.97〜1 の範囲にあります。
Comments:
コメント:
By the end of the first round, it is evident that the output from the algorithm appears to be random for all 189 statistical tests. Subsequent rounds produce similar statistics.
第 1 ラウンドの終わりまでに、アルゴリズムの出力が 189 のすべての統計的検定でランダムに見えることは明らかです。それ以降のラウンドでも、同様の統計量が得られます。
4.2.2 RC6 Algorithm
4.2.2 RC6 アルゴリズム
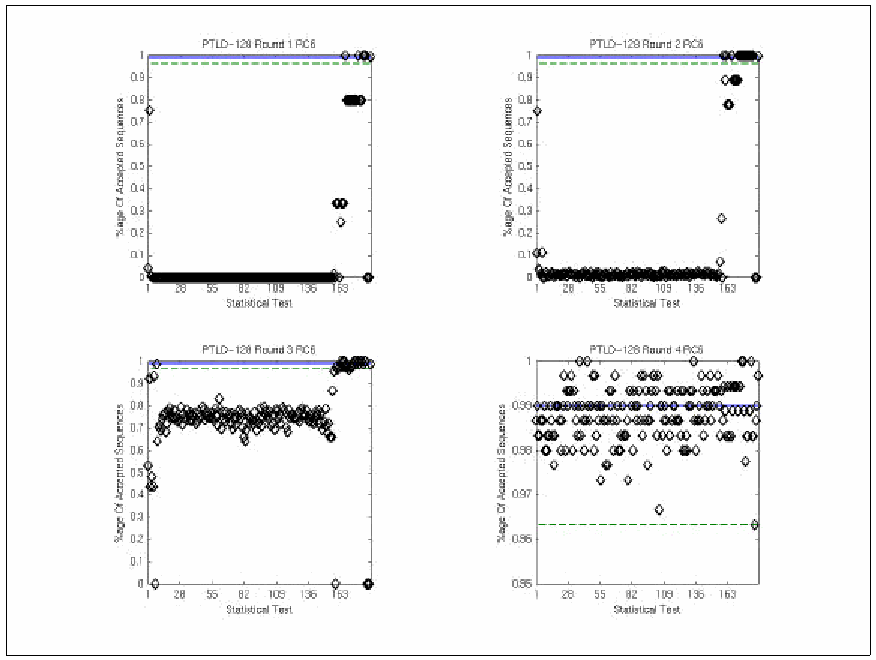
2行2列に並んだ4つの散布図です。題は「PTLD-128 Round 1 RC6」、「PTLD-128 Round 2 RC6」、「PTLD-128 Round 3 RC6」、「PTLD-128 Round 4 RC6」です。各図は、189の統計検定について、縦軸に受理された系列の割合(%age Of Accepted Sequences)、横軸に統計検定の番号(Statistical Test、目盛り 1、28、55、82、109、136、163)をとり、0.99 の実線(期待される割合)と約 0.9633 の破線(受容閾値)を示します。ラウンド1〜3は縦軸が 0〜1 で、多くの点が破線を大きく下回ります(ラウンド1・2は 0 付近、ラウンド3は約 0.7〜0.8)。ラウンド4(「PTLD-128 Round 4 RC6」、縦軸 0.95〜1)では、ほぼすべての点が破線より上にあります。
Comments:
コメント:
At the end of the first round, it is evident that the output from the algorithm is non-random, given that the majority of the 189 statistical tests fall below 96%. At the end of the second and third round, it is still evident that the output is non-random. It isn’t until the end of the fourth round that the results appear to be random. Subsequent rounds produce statistics similar to those obtained at round 4.
第 1 ラウンドの終わりでは、189 の統計的検定の大多数が 96% を下回っているため、アルゴリズムの出力がランダムでないことは明らかです。第 2 ラウンドと第 3 ラウンドの終わりでも、出力がランダムでないことは依然として明らかです。結果がランダムに見えるのは、第 4 ラウンドの終わりになってからです。それ以降のラウンドでは、第 4 ラウンドで得られたものと同様の統計量が得られます。
4.2.3 Rijndael Algorithm
4.2.3 Rijndael アルゴリズム
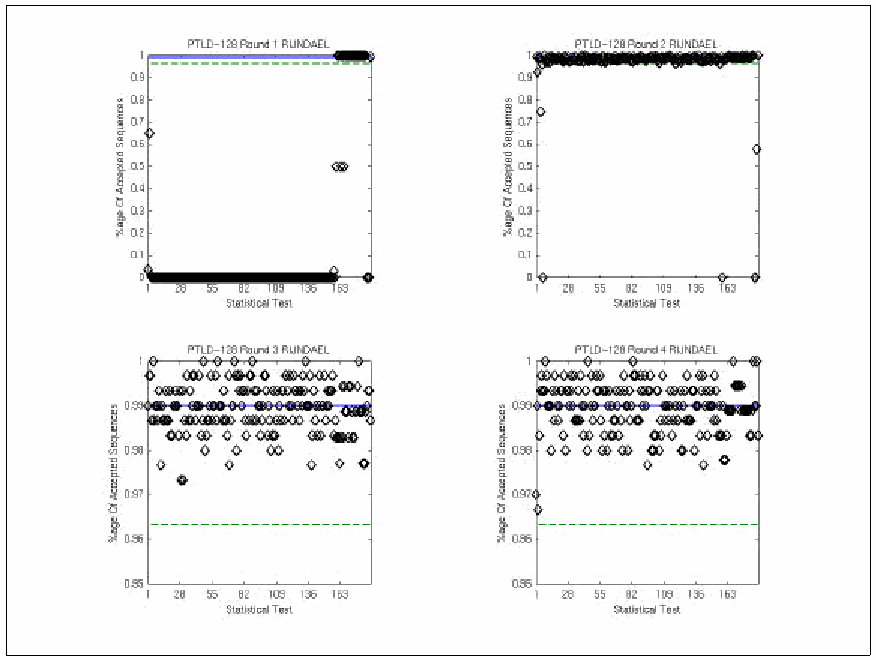
2行2列に並んだ4つの散布図です。題は 「PTLD-128 Round 1 RIJNDAEL」、「PTLD-128 Round 2 RIJNDAEL」、「PTLD-128 Round 3 RIJNDAEL」、「PTLD-128 Round 4 RIJNDAEL」 です。各図は、189の統計検定について、縦軸に受理された系列の割合(%age Of Accepted Sequences)、横軸に統計検定の番号(Statistical Test、目盛り 1、28、55、82、109、136、163)をとり、0.99 の実線(期待される割合)と約 0.9633 の破線(受理の基準)を示します。ラウンド1・2は縦軸が 0〜1 で、ラウンド1はほとんどの点が 0 付近、ラウンド2はほとんどの点が 1 付近にあり、いくつかの点が大きく下回ります。ラウンド3・4は縦軸が 0.95〜1 で、ほぼすべての点が破線より上にあります。
Comments:
コメント:
At the end of the first round, it is evident that the output from the algorithm is non-random, given that the majority of the 189 statistical tests fall below 96%. At the end of the second round, it is still evident that the output is non-random. It isn’t until the end of the third round that the results appear to be random. Subsequent rounds produce statistics similar to those obtained at round 3.
第 1 ラウンドの終わりでは、189 の統計的検定の大多数が 96% を下回っているため、アルゴリズムの出力がランダムでないことは明らかです。第 2 ラウンドの終わりでも、出力がランダムでないことは依然として明らかです。結果がランダムに見えるのは、第 3 ラウンドの終わりになってからです。それ以降のラウンドでは、第 3 ラウンドで得られたものと同様の統計量が得られます。
4.2.4 Serpent Algorithm
4.2.4 Serpent アルゴリズム
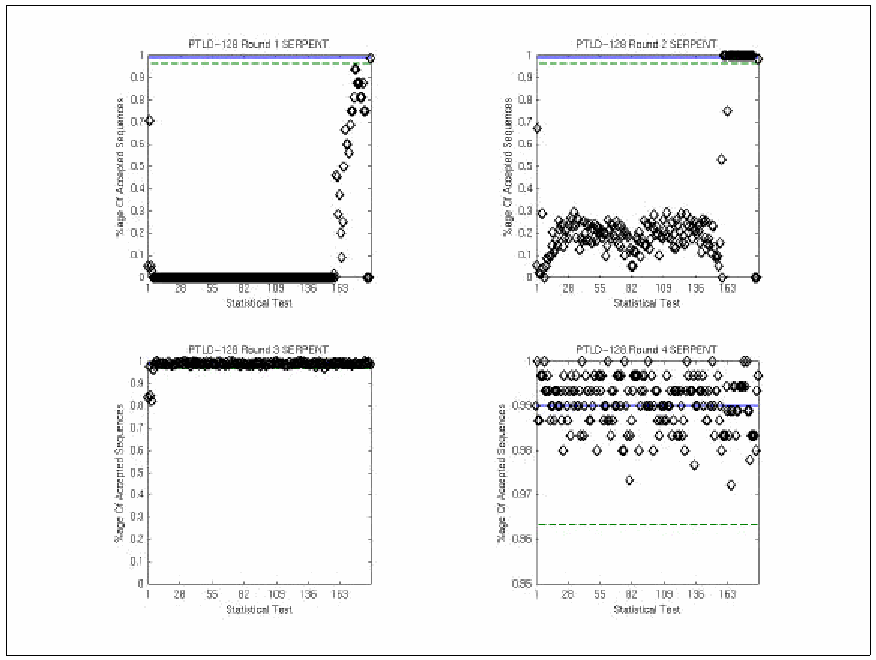
2行2列に並んだ4つの散布図です。題は 「PTLD-128 Round 1 SERPENT」、「PTLD-128 Round 2 SERPENT」、「PTLD-128 Round 3 SERPENT」、「PTLD-128 Round 4 SERPENT」 です。各図は、189の統計検定について、縦軸に受理された系列の割合(%age Of Accepted Sequences)、横軸に統計検定の番号(Statistical Test、目盛り 1、28、55、82、109、136、163)をとり、0.99 の実線(期待される割合)と約 0.9633 の破線(受理の基準)を示します。ラウンド1〜3は縦軸が 0〜1 で、ラウンド1はほとんどの点が 0 付近、ラウンド2は多くの点が 0〜0.3、ラウンド3はほとんどの点が 1 付近(いくつかが約 0.85)にあります。ラウンド4は縦軸が 0.95〜1 で、すべての点が破線より上にあります。
Comments:
コメント:
At the end of the first round, it is evident that the output from the algorithm is non-random, given that the majority of the 189 statistical tests fall below 96%. At the end of the second and third round, it is still evident that the output is non-random. It isn’t until the end of the fourth round that the results appear to be random. Subsequent rounds produce statistics that are similar to those obtained at round 4.
第 1 ラウンドの終わりでは、189 の統計的検定の大多数が 96% を下回っているため、アルゴリズムの出力がランダムでないことは明らかです。第 2 ラウンドと第 3 ラウンドの終わりでも、出力がランダムでないことは依然として明らかです。結果がランダムに見えるのは、第 4 ラウンドの終わりになってからです。それ以降のラウンドでは、第 4 ラウンドで得られたものと同様の統計量が得られます。
4.2.5 Twofish Algorithm
4.2.5 Twofish アルゴリズム
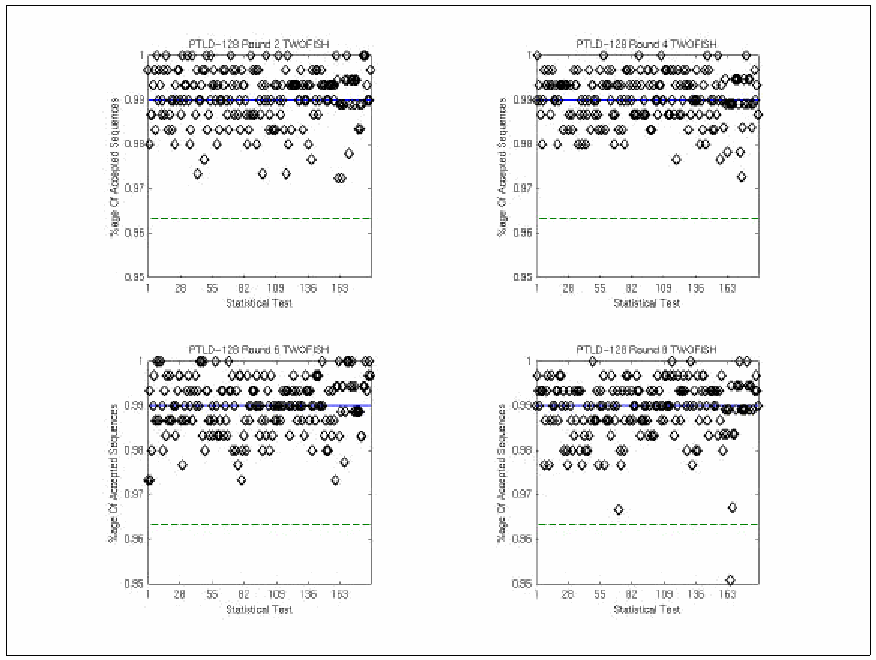
2行2列に並んだ4つの散布図です。題は 「PTLD-128 Round 2 TWOFISH」、「PTLD-128 Round 4 TWOFISH」、「PTLD-128 Round 6 TWOFISH」、「PTLD-128 Round 8 TWOFISH」 です。各図は、189の統計検定について、縦軸に受理された系列の割合(%age Of Accepted Sequences)、横軸に統計検定の番号(Statistical Test、目盛り 1、28、55、82、109、136、163)をとり、0.99 の実線(期待される割合)と約 0.9633 の破線(受理の基準)を示します。4つの図とも縦軸は 0.95〜1 で、ラウンド8の 0.95 付近の1点を除き、ほぼすべての点が破線より上にあります。
Comments:
コメント:
By the end of the second round (the first round pair), it is evident that the output from the algorithm appears to be random for all 189 statistical tests. Rounds 4 and 6 produce results similar to those produced at round 2. However, at round 8, test identifier 165 (i.e., the random excursions test18) appears to have failed the acceptance criterion rule with 9 rejections out of 183 binary sequences. Upon closer inspection, it was determined that only 183 of the 300 sequences were processed because of a random excursion test constraint. For 183 sequences, the cutoff percentage is 95.08%. With this cutoff point, test 165 passed the test. Subsequent rounds pairs produced statistics that were similar to those obtained for round 2, 4, and 6.
第 2 ラウンド(最初のラウンドの組)の終わりまでに、アルゴリズムの出力が 189 のすべての統計的検定でランダムに見えることは明らかです。第 4 ラウンドと第 6 ラウンドでは、第 2 ラウンドで得られたものと同様の結果が得られます。しかし、第 8 ラウンドでは、検定識別子 165(すなわち、ランダムエクスカーション検定18)が、183 個の 2 値系列のうち 9 個が棄却されたことで、受容基準の規則に不合格となったように見えます。詳しく調べたところ、ランダムエクスカーション検定の制約により、300 個の系列のうち 183 個しか処理されていなかったことが判明しました。183 個の系列では、カットオフの割合は 95.08% です。このカットオフ点では、検定 165 は合格となります。それ以降のラウンドの組では、第 2、4、6 ラウンドで得られたものと同様の統計量が得られました。
5 Summary and Conclusion
5 まとめと結論
During the AES Round 2 analysis period, NIST further investigated the randomness of the output for each of the finalists. The range of analyses was extended beyond the 128-bit keysize case conducted during the AES Round 1 analysis period. In this study, empirical statistical testing was performed on the 192-bit and 256-bit key sizes under full round considerations. In addition, partial round testing was conducted for the 128-bit keysize case.
AES の第 2 ラウンドの分析期間中、NIST は、最終候補それぞれの出力のランダムネスをさらに調査しました。分析の範囲は、AES の第 1 ラウンドの分析期間中に実施した 128 ビット鍵長のケースを超えて拡張されました。本研究では、全ラウンドでの検討の下で、192 ビットと 256 ビットの鍵長について経験的な統計的検定を実施しました。加えて、128 ビット鍵長のケースについて部分ラウンド検定を実施しました。
In each of these cases, a total of 189 statistical tests were applied on the different data sets. These tests collectively span many well-known properties that any good cryptographic algorithm should satisfy. These properties include the absence of any detectable correlation between plaintext/ciphertext pairs and the absence of any detectable bias due to single bit changes to a plaintext block, a 192-bit key or a 256-bit key.
これらのそれぞれのケースで、合計 189 の統計的検定を、異なるデータセットに適用しました。これらの検定は全体として、優れた暗号アルゴリズムが満たすべき多くのよく知られた性質を網羅しています。これらの性質には、平文と暗号文のペアの間に検出可能な相関がないこと、および、平文ブロック、192 ビットの鍵、または 256 ビットの鍵の 1 ビットの変化に起因する検出可能な偏りがないことが含まれます。
In one instance there was a statistical anomaly. Serpent’s plaintext/ciphertext correlation (based on 256-bit keys) yielded 12 rejections out of a sample of 300 binary sequences, using the aperiodic template statistical test. Subsequent experiments were conducted, and no other anomalies were detected.
1 つのケースで、統計的な異常がありました。Serpent の平文と暗号文の相関(256 ビット鍵に基づく)は、非周期テンプレートの統計的検定を用いたところ、300 個の 2 値系列の標本のうち 12 個が棄却されました。追加の実験を実施しましたが、ほかに異常は検出されませんでした。
The results for the partial round testing, based on 128-bit key plaintext low density data, indicate that Mars achieves randomness at round 6, RC6 at round 4, Rijndael at round 3, Serpent at round 4, and Twofish at round 2.
128 ビット鍵の平文低密度データに基づく部分ラウンド検定の結果は、Mars は第 6 ラウンド、RC6 は第 4 ラウンド、Rijndael は第 3 ラウンド、Serpent は第 4 ラウンド、Twofish は第 2 ラウンドでランダムネスを達成することを示しています。
In spite of an isolated statistical anomaly in Serpent, it is fair to state that all of the algorithms appear to have no detectable deviations from randomness.
Serpent に孤立した統計的異常があったものの、すべてのアルゴリズムは、ランダムネスからの検出可能な逸脱がないように見えると述べるのが妥当です。
Acknowledgments
謝辞
We would like to acknowledge the efforts of Dr. Andrew Rukhin who derived the statistical tests, and Dr. Jim Nechvatal who proposed the types of data to be analyzed. We would like to also thank Dr. Morris Dworkin, Elaine Barker, Sharon Keller, Dr. Mark Levenson and members of the AES3 program committee for providing valuable comments regarding this paper.
統計的検定を導出した Dr. Andrew Rukhin と、分析するデータの種類を提案した Dr. Jim Nechvatal の尽力に感謝いたします。また、本稿について貴重なコメントをくださった Dr. Morris Dworkin、Elaine Barker、Sharon Keller、Dr. Mark Levenson、および AES3 プログラム委員会の委員の皆さまにも感謝いたします。
References
参考文献
[1] A. Meneses, P. van Oorschot and S. Vanstone, Handbook of Applied Cryptography, CRC Press, 1997.
[1] A. Meneses, P. van Oorschot and S. Vanstone, Handbook of Applied Cryptography, CRC Press, 1997.
[2] A. Rukhin, et. al., A Statistical Test Suite for the Validation of Random and Pseudo Random Number Generators for Cryptographic Applications19, NIST Special Publication (under preparation), Spring 2000.
[2] A. Rukhin, et. al., A Statistical Test Suite for the Validation of Random and Pseudo Random Number Generators for Cryptographic Applications19, NIST Special Publication (under preparation), Spring 2000.
[3] J. Soto, “Randomness Testing of the Advanced Encryption Standard Candidate Algorithms,” NIST IR 6390, September 1999.
[3] J. Soto, “Randomness Testing of the Advanced Encryption Standard Candidate Algorithms,” NIST IR 6390, September 1999.
[4] J. Soto, “Statistical Testing of Random Number Generators,” Proceedings of the 22nd National Information Systems Security Conference, Crystal City, Virginia, October 1999.
[4] J. Soto, “Statistical Testing of Random Number Generators,” Proceedings of the 22nd National Information Systems Security Conference, Crystal City, Virginia, October 1999.
Appendix A Description of the Statistical Tests20
付録 A 統計的検定の説明20
Monobit Test: The purpose of this test is to determine whether the number of ones and zeros in a sequence are approximately the same as would be expected for a truly random sequence.
Monobit Test: この検定の目的は、系列中の 1 と 0 の数が、真にランダムな系列で期待される数とほぼ同じかどうかを判定することです。
Block Frequency Test: The purpose of the block frequency test is to determine whether the number of ones and zeros in each of M non-overlapping blocks created from a sequence appear to have a random distribution.
Block Frequency Test: ブロック頻度検定の目的は、系列から作られた M 個の重ならないブロックのそれぞれにおける 1 と 0 の数が、ランダムな分布を示しているように見えるかどうかを判定することです。
Cumulative Sums Forward (Reverse) Test: The purpose of the cumulative sums test is to determine whether the sum of the partial sequences occurring in the tested sequence is too large or too small.
Cumulative Sums Forward (Reverse) Test: 累積和検定の目的は、被検系列に現れる部分系列の和が大きすぎるか小さすぎるかを判定することです。
Runs Test: The purpose of the runs test is to determine whether the number of runs of ones and zeros of various lengths is as expected for a random sequence. In particular, this test determines whether the oscillation between such substrings is too fast or too slow.
Runs Test: ラン検定の目的は、さまざまな長さの 1 と 0 のランの数が、ランダムな系列で期待されるとおりかどうかを判定することです。特にこの検定は、そのような部分文字列の間の振動が速すぎるか遅すぎるかを判定します。
Long Runs of Ones Test: The purpose of this test is to determine whether the longest run of ones within the tested sequence is consistent with the longest run of ones that would be expected in a random sequence.
Long Runs of Ones Test: この検定の目的は、被検系列中の最長の 1 のランが、ランダムな系列で期待される最長の 1 のランと整合しているかどうかを判定することです。
Rank Test: The purpose of this test is to check for linear dependence among fixed length substrings of the original sequence.
Rank Test: この検定の目的は、元の系列の固定長の部分列の間に線形従属性がないかを調べることです。
Discrete Fourier Transform (Spectral) Test: The purpose of this test is to detect periodic features (i.e., repetitive patterns that are near each other) in the tested sequence that would indicate a deviation from the assumption of randomness.
Discrete Fourier Transform (Spectral) Test: この検定の目的は、ランダムネスの仮定からの逸脱を示す、被検系列中の周期的な特徴(すなわち、互いに近くにある反復パターン)を検出することです。
Aperiodic Templates Test: The purpose of this test is to reject sequences that exhibit too many occurrences of a given non-periodic (aperiodic) pattern.
Aperiodic Templates Test: この検定の目的は、与えられた非周期(aperiodic)パターンの出現が多すぎる系列を棄却することです。
Periodic Template Test: The purpose of this test is to reject sequences that show deviations from the expected number of runs of ones of a given length.
Periodic Template Test: この検定の目的は、与えられた長さの 1 のランの期待数からの逸脱を示す系列を棄却することです。
Universal Statistical Test: The purpose of the test is to detect whether or not the sequence can be significantly compressed without loss of information. A compressible sequence is considered to be non-random.
Universal Statistical Test: この検定の目的は、系列が情報を失うことなく大幅に圧縮できるかどうかを検出することです。圧縮可能な系列は、ランダムでないと見なされます。
Approximate Entropy Test: The purpose of the test is to compare the frequency of overlapping blocks of two consecutive/adjacent lengths (m and m+1) against the expected result for a normally distributed sequence.
Approximate Entropy Test: この検定の目的は、連続する(隣り合う)2 つの長さ(m と m+1)の重なるブロックの頻度を、正規分布に従う系列に対して期待される結果と比較することです。
Random Excursion Test: The purpose of this test is to determine if the number of visits to a state within a random walk exceeds what one would expect for a random sequence.
Random Excursion Test: この検定の目的は、ランダムウォークにおける状態への訪問回数が、ランダムな系列で期待される回数を超えているかどうかを判定することです。
Random Excursion Variant Test: The purpose of this test is to detect deviations from the distribution of the number of visits of a random walk to a certain state.
Random Excursion Variant Test: この検定の目的は、ランダムウォークによる特定の状態への訪問回数の分布からの逸脱を検出することです。
Serial Test: The purpose of this test is to determine whether the number of occurrences of m-bit overlapping patterns is approximately the same as would be expected for a random sequence.
Serial Test: この検定の目的は、m ビットの重なるパターンの出現数が、ランダムな系列で期待される数とほぼ同じかどうかを判定することです。
Lempel-Ziv Complexity Test: The purpose of the test is to determine how far the tested sequence can be compressed. The sequence is considered to be non-random if it can be significantly compressed
Lempel-Ziv Complexity Test: この検定の目的は、被検系列をどこまで圧縮できるかを判定することです。系列が大幅に圧縮できる場合は、ランダムでないと見なされます
Linear Complexity Test: The purpose of this test is to determine whether or not the sequence is complex enough to be considered random.
Linear Complexity Test: この検定の目的は、系列がランダムと見なせるほど複雑かどうかを判定することです。
Appendix B Description of the Data Types
付録 B データ種別の説明
1 Plaintext Avalanche
1 平文の雪崩
To examine the sensitivity of individual algorithms to changes in the plaintext, 300 binary sequences were analyzed. The 300 sequences were parsed from a string constructed as follows: given 19,200 random 128-bit plaintext blocks, and a 192-bit (or 256-bit) key of all zeroes, 2,457,600 derived blocks were concatenated. Each derived block was based on the XOR of the “ciphertext formed using the fixed 192-bit (or 256-bit) key and the random plaintext,” and the “ciphertext formed using the fixed 192-bit (or 256-bit) key and the perturbed random plaintext with the ith bit changed, for \(1 \le i \le 128\).” A total of 128 sets of derived blocks were formed for each random plaintext. All derived blocks were concatenated, and a total of 2,457,600 derived blocks resulted. The 300 sequences of 1,048,576 bits (8,192 blocks) were parsed from the concatenated derived blocks.
個々のアルゴリズムの平文の変化に対する感度を調べるため、300 個の 2 値系列を分析しました。300 個の系列は、次のように構成した文字列から切り出しました。19,200 個のランダムな 128 ビット平文ブロックと、すべてゼロの 192 ビット(または 256 ビット)鍵が与えられたとき、2,457,600 個の派生ブロックを連結しました。各派生ブロックは、「固定の 192 ビット(または 256 ビット)鍵とランダムな平文を用いて形成した暗号文」と、「固定の 192 ビット(または 256 ビット)鍵と、\(1 \le i \le 128\) について i番目のビットを変更した摂動を加えたランダムな平文を用いて形成した暗号文」の XOR に基づいています。各ランダム平文について、合計 128 組の派生ブロックを形成しました。すべての派生ブロックを連結した結果、合計 2,457,600 個の派生ブロックとなりました。1,048,576 ビット(8,192 ブロック)の 300 個の系列は、連結した派生ブロックから切り出しました。
2 192-bit (or 256-bit) Key Avalanche
2 192 ビット(または 256 ビット)鍵の雪崩
To examine the sensitivity of individual algorithms to changes in the 192-bit (or 256-bit key), 300 binary sequences were analyzed in each case. The 300 sequences were parsed from a string constructed as follows: given 19,200 random 192-bit (256-bit) keys, and a plaintext of all zeroes, 2,457,600 derived blocks were concatenated. Each derived block was based on the XOR of the “ciphertext formed using the fixed plaintext and one of the random 192-bit (or 256-bit) keys,” and the “ciphertext formed using the fixed plaintext and a perturbed form of the random 192-bit (or 256-bit) key with the ith bit changed, for \(1 \le i \le 128\).” Note that bits 129-192 (or 129-256) are unchanged. A total of 128 sets of derived blocks were formed for each random key. All derived blocks were concatenated, and a total of 2,457,600 derived blocks resulted. The 300 sequences of 1,048,576 bits (8,192 blocks) were parsed from the concatenated derived blocks.
192 ビット(または 256 ビット)鍵の変化に対する個々のアルゴリズムの感度を調べるため、それぞれのケースで 300 個の 2 値系列を分析しました。300 個の系列は、次のように構成した文字列から切り出しました。19,200 個のランダムな 192 ビット(または 256 ビット)鍵と、すべてゼロの平文が与えられたとき、2,457,600 個の派生ブロックを連結しました。各派生ブロックは、「固定の平文とランダムな 192 ビット(または 256 ビット)鍵の 1 つを用いて形成した暗号文」と、「固定の平文と、\(1 \le i \le 128\) について i番目のビットを変更した摂動を加えた形のランダムな 192 ビット(または 256 ビット)鍵を用いて形成した暗号文」の XOR に基づいています。ビット 129〜192(または 129〜256)は変更されないことに注意してください。各ランダム鍵について、合計 128 組の派生ブロックを形成しました。すべての派生ブロックを連結した結果、合計 2,457,600 個の派生ブロックとなりました。1,048,576 ビット(8,192 ブロック)の 300 個の系列は、連結した派生ブロックから切り出しました。
3 Plaintext/Ciphertext Correlation
3 平文と暗号文の相関
In order to study the correlation of plaintext/ciphertext pairs, 300 sequences (1,048,576 bits per sequence) were examined for each algorithm. Given a random 192-bit (or 256-bit) key and 8,192 random plaintext blocks, a binary sequence was constructed concatenating 8,192 derived blocks (where a derived block is the result of applying the XOR operator on the plaintext block and its corresponding ciphertext block computed in the ECB mode). Using the 8,192 (previously selected) plaintext blocks, the procedure was repeated 300 times, i.e., once for each (additional) random 192-bit (or 256-bit) key.
平文と暗号文のペアの相関を調べるため、各アルゴリズムについて 300 個の系列(1 系列あたり 1,048,576 ビット)を検査しました。ランダムな 192 ビット(または 256 ビット)鍵と 8,192 個のランダムな平文ブロックが与えられたとき、8,192 個の派生ブロック(派生ブロックとは、平文ブロックと、ECB モードで計算したそれに対応する暗号文ブロックに XOR 演算子を適用した結果)を連結して、2 値系列を構成しました。8,192 個の(先に選んだ)平文ブロックを使って、この手順を 300 回、すなわち(追加の)ランダムな 192 ビット(または 256 ビット)鍵ごとに 1 回ずつ繰り返しました。
4 Cipher Block Chaining Mode
4 暗号ブロック連鎖モード
Given a random 192-bit (or 256-bit) key, a 128-bit initialization vector (IV) of all zeroes, and 8,192 128-bit plaintext blocks (PT) of all zeroes, a binary sequence of 1,048,576 bits was constructed using ciphertext computed in the CBC mode. That is, a binary sequence consisted of 8,192 concatenated 128-bit ciphertext blocks. The first ciphertext block (\(CT_1\)) is defined by \(CT_1 = E_k(IV \oplus PT_0)\). Subsequent ciphertext blocks were defined by \(CT_{i+1} = E_k(CT_i \oplus PT_i)\) for \(1 \le i \le 8{,}191\). In all, 300 binary sequences were constructed, each with a different random 192-bit (or 256-bit) key.
ランダムな 192 ビット(または 256 ビット)鍵、すべてゼロの 128 ビットの初期化ベクトル(IV)、およびすべてゼロの 8,192 個の 128 ビット平文ブロック(PT)が与えられたとき、CBC モードで計算した暗号文を用いて、1,048,576 ビットの 2 値系列を構成しました。すなわち、2 値系列は、連結した 8,192 個の 128 ビット暗号文ブロックで構成されます。最初の暗号文ブロック(\(CT_1\))は、\(CT_1 = E_k(IV \oplus PT_0)\) で定義されます。それ以降の暗号文ブロックは、\(CT_{i+1} = E_k(CT_i \oplus PT_i)\) (\(1 \le i \le 8{,}191\))で定義されました。全体で 300 個の 2 値系列を構成し、それぞれに異なるランダムな 192 ビット(または 256 ビット)鍵を使いました。
5 Low Density Plaintext
5 低密度平文
Data sets were created based on low-density plaintext blocks. Each data set consisted of 300 sequences. Each sequence consisted of 8,257 ciphertext blocks, computed in the ECB mode, using a distinct random key per sequence. For low-density plaintext, two data sets were created, one using a random 192-bit key, and the other using a random 256-bit key. The first ciphertext block was calculated using an all zero plaintext block. Ciphertext blocks 2 - 129 were calculated using plaintext blocks consisting of a single one and 127 zeros, the one appearing in each of the 128 bit positions of the plaintext block. Ciphertext blocks 130 - 8,257 were calculated using plaintext blocks consisting of two ones and 126 zeros, the ones appearing in each combination of two bit positions of the plaintext block.
低密度の平文ブロックに基づいて、データセットを作成しました。各データセットは 300 個の系列で構成されました。各系列は、系列ごとに異なるランダムな鍵を使って ECB モードで計算した、8,257 個の暗号文ブロックで構成されました。低密度平文については、2 つのデータセットを作成しました。1 つはランダムな 192 ビット鍵を使い、もう 1 つはランダムな 256 ビット鍵を使いました。最初の暗号文ブロックは、すべてゼロの平文ブロックを使って計算しました。暗号文ブロック 2〜129 は、1 が 1 つと 0 が 127 個からなる平文ブロックを使って計算しました。この 1 は、平文ブロックの 128 のビット位置のそれぞれに現れます。暗号文ブロック 130〜8,257 は、1 が 2 つと 0 が 126 個からなる平文ブロックを使って計算しました。この 1 は、平文ブロックの 2 つのビット位置のあらゆる組み合わせに現れます。
6 Low Density 192-bit (and 256-bit) Keys
6 低密度の192ビット(および256ビット)鍵
Data sets were created based on low-density 192-bit (or 256-bit) keys. Each data set consisted of 300 sequences. Each sequence consisted of 8,257 ciphertext blocks computed in the ECB mode. For low-density keys, data sets were created for each key size. For each key size and for each sequence, a different random plaintext block was used. The first ciphertext block was calculated using a 192-bit (or 256-bit) key of all zeroes. Ciphertext blocks 2-129 were calculated using a 192-bit key (or 256-bit key) with a single one in each of the first 128-bit positions of the 192-bit (or 256-bit) key. All other key bits were set to zero. Ciphertext blocks 130 - 8,257 were calculated using a 192-bit (or 256-bit) key with two ones in each combination of two bit positions of the first 128 bits of the key. All other key bits were set to zero.
低密度の 192 ビット(または 256 ビット)鍵に基づいて、データセットを作成しました。各データセットは 300 個の系列で構成されました。各系列は、ECB モードで計算した 8,257 個の暗号文ブロックで構成されました。低密度鍵については、鍵長ごとにデータセットを作成しました。鍵長ごと、系列ごとに、異なるランダムな平文ブロックを使いました。最初の暗号文ブロックは、すべてゼロの 192 ビット(または 256 ビット)鍵を使って計算しました。暗号文ブロック 2〜129 は、192 ビット鍵(または 256 ビット鍵)の最初の 128 のビット位置のそれぞれに 1 を 1 つ置いた鍵を使って計算しました。鍵の他のビットはすべてゼロに設定しました。暗号文ブロック 130〜8,257 は、鍵の最初の 128 ビットの 2 つのビット位置のあらゆる組み合わせに 1 を 2 つ置いた、192 ビット(または 256 ビット)鍵を使って計算しました。鍵の他のビットはすべてゼロに設定しました。
7 High Density Plaintext
7 高密度平文
Data sets were created based on high-density plaintext blocks. Each data set consisted of 300 sequences. Each sequence consisted of 8,257 ciphertext blocks computed in the ECB mode, using a distinct key. For high-density plaintext, two data sets were created, one using a different random 192-bit key for each sequence, and the other using a different random 256-bit key for each sequence. The first ciphertext block was calculated using an all ones plaintext block. Ciphertext blocks 2 - 129 were calculated using plaintext blocks consisting of a single zero and 127 ones, the zero appearing in each of the 128 bit positions of the plaintext block. Ciphertext blocks 130 - 8,257 were calculated using plaintext blocks consisting of two zeros and 126 ones, the zeros appearing in each combination of two bit positions of the plaintext block.
高密度の平文ブロックに基づいて、データセットを作成しました。各データセットは 300 個の系列で構成されました。各系列は、異なる鍵を使って ECB モードで計算した、8,257 個の暗号文ブロックで構成されました。高密度平文については、2 つのデータセットを作成しました。1 つは系列ごとに異なるランダムな 192 ビット鍵を使い、もう 1 つは系列ごとに異なるランダムな 256 ビット鍵を使いました。最初の暗号文ブロックは、すべて 1 の平文ブロックを使って計算しました。暗号文ブロック 2〜129 は、0 が 1 つと 1 が 127 個からなる平文ブロックを使って計算しました。この 0 は、平文ブロックの 128 のビット位置のそれぞれに現れます。暗号文ブロック 130〜8,257 は、0 が 2 つと 1 が 126 個からなる平文ブロックを使って計算しました。この 0 は、平文ブロックの 2 つのビット位置のあらゆる組み合わせに現れます。
8 High Density 192-bit (and 256-bit) Keys
8 高密度の192ビット(および256ビット)鍵
Data sets were created based on high-density 192-bit (or 256-bit) keys. Each data set consisted of 300 sequences. Each sequence consisted of 8,257 ciphertext blocks computed in the ECB mode. For high-density keys, data sets were created for each key size. For each key size and for each sequence, a different random plaintext block was used. The first ciphertext block was calculated using a 192-bit (or 256-bit) key of all ones. Ciphertext blocks 2-129 were calculated using a 192-bit (or 256-bit) key with a single zero in each of the first 128-bit positions of the 192-bit (or 256-bit) key. All other key bits were set to one. Ciphertext blocks 130 - 8,257 were calculated using a 192-bit (or 256-bit) key with two zeros in each combination of two bit positions of the first 128 bits of the key. All other key bits were set to one.
高密度の 192 ビット(または 256 ビット)鍵に基づいて、データセットを作成しました。各データセットは 300 個の系列で構成されました。各系列は、ECB モードで計算した 8,257 個の暗号文ブロックで構成されました。高密度鍵については、鍵長ごとにデータセットを作成しました。鍵長ごと、系列ごとに、異なるランダムな平文ブロックを使いました。最初の暗号文ブロックは、すべて 1 の 192 ビット(または 256 ビット)鍵を使って計算しました。暗号文ブロック 2〜129 は、192 ビット(または 256 ビット)鍵の最初の 128 のビット位置のそれぞれに 0 を 1 つ置いた鍵を使って計算しました。鍵の他のビットはすべて 1 に設定しました。暗号文ブロック 130〜8,257 は、鍵の最初の 128 ビットの 2 つのビット位置のあらゆる組み合わせに 0 を 2 つ置いた、192 ビット(または 256 ビット)鍵を使って計算しました。鍵の他のビットはすべて 1 に設定しました。
Appendix C The likelihood of q failures in a data set21
付録 C データセットにおける q 個の失敗の起こりやすさ21
| A | B | C | D | E |
|---|---|---|---|---|
| No. of successes (p) | No. of failures (q) | Proportion of successes out of 300 | Probability of each event in column C | P-value associated with each event |
| 300 | 0 | 1.0000 | 0.0490408940700000 | 1.0000000000000000 |
| 299 | 1 | 0.9967 | 0.1486087699000000 | 0.9509591059000000 |
| 298 | 2 | 0.9933 | 0.2244142536000000 | 0.8023503360000000 |
| 297 | 3 | 0.9900 | 0.2251698571000000 | 0.5779360824000000 |
| 296 | 4 | 0.9867 | 0.1688773928000000 | 0.3527662253000000 |
| 295 | 5 | 0.9833 | 0.1009852692000000 | 0.1838888325000000 |
| 294 | 6 | 0.9800 | 0.0501526168800000 | 0.0829035633000000 |
| 293 | 7 | 0.9767 | 0.0212768677700000 | 0.0327509464000000 |
| 292 | 8 | 0.9733 | 0.0078713664860000 | 0.0114740786000000 |
| 291 | 9 | 0.9700 | 0.0025796172990000 | 0.0036027121000000 |
| 290 | 10 | 0.9667 | 0.0007582511453000 | 0.0010230948000000 |
| 289 | 11 | 0.9633 | 0.0002019217926000 | 0.0002648437000000 |
| 288 | 12 | 0.9600 | 0.0000491207054500 | 0.0000629219000000 |
| 287 | 13 | 0.9567 | 0.0000109920459800 | 0.0000138012000000 |
| 286 | 14 | 0.9533 | 0.0000022761307320 | 0.0000028092000000 |
| 285 | 15 | 0.9500 | 0.0000004383659188 | 0.0000005331000000 |
| [284,0] | [16,300] | [0.9467, 0.0000] | [0.0000000788726559, 0.0000000000000000] | [0.0000000947000000, 0.0000000000000000] |
| A | B | C | D | E |
|---|---|---|---|---|
| 成功数 (p) | 失敗数 (q) | 300 個のうちの成功の割合 | C 列の各事象の確率 | 各事象に対応する P 値 |
| 300 | 0 | 1.0000 | 0.0490408940700000 | 1.0000000000000000 |
| 299 | 1 | 0.9967 | 0.1486087699000000 | 0.9509591059000000 |
| 298 | 2 | 0.9933 | 0.2244142536000000 | 0.8023503360000000 |
| 297 | 3 | 0.9900 | 0.2251698571000000 | 0.5779360824000000 |
| 296 | 4 | 0.9867 | 0.1688773928000000 | 0.3527662253000000 |
| 295 | 5 | 0.9833 | 0.1009852692000000 | 0.1838888325000000 |
| 294 | 6 | 0.9800 | 0.0501526168800000 | 0.0829035633000000 |
| 293 | 7 | 0.9767 | 0.0212768677700000 | 0.0327509464000000 |
| 292 | 8 | 0.9733 | 0.0078713664860000 | 0.0114740786000000 |
| 291 | 9 | 0.9700 | 0.0025796172990000 | 0.0036027121000000 |
| 290 | 10 | 0.9667 | 0.0007582511453000 | 0.0010230948000000 |
| 289 | 11 | 0.9633 | 0.0002019217926000 | 0.0002648437000000 |
| 288 | 12 | 0.9600 | 0.0000491207054500 | 0.0000629219000000 |
| 287 | 13 | 0.9567 | 0.0000109920459800 | 0.0000138012000000 |
| 286 | 14 | 0.9533 | 0.0000022761307320 | 0.0000028092000000 |
| 285 | 15 | 0.9500 | 0.0000004383659188 | 0.0000005331000000 |
| [284,0] | [16,300] | [0.9467, 0.0000] | [0.0000000788726559, 0.0000000000000000] | [0.0000000947000000, 0.0000000000000000] |
To facilitate the interpretation of each of the experiments, NIST enumerated all possible events corresponding to the likelihood that q binary sequences are rejected out of 300, using a binomial distribution, with the significance level set at 1%. Each row corresponds to a single event, with the exception of the last one. This last row contains an interval that accounts for all remaining events from 16 to 300 (rejections). Note: Entries in the table reflect events that are represented in the graphs depicted in sections 4.2.1 to 4.2.5.
各実験の解釈を容易にするため、NIST は、有意水準を 1% に設定した二項分布を用いて、300 個のうち q 個の 2 値系列が棄却される起こりやすさに対応する、あり得るすべての事象を列挙しました。最後の行を除き、各行は 1 つの事象に対応します。この最後の行には、棄却数 16〜300 の残りのすべての事象をまとめた区間が含まれています。注: 表のエントリは、4.2.1 節から 4.2.5 節に示したグラフに表されている事象を反映しています。
Column A denotes the number of binary sequences that are accepted as being random by a statistical test at the 1% significance level. Column B denotes the number of binary sequences that are rejected as being random by a statistical test at the 1% significance level. Columns C and D denote the proportion of binary sequences that passed a statistical test at the 1% significance level, and its associated likelihood, respectively. Finally, column E denotes the P-values, which correspond to the probability of observing the number of failures or greater.
A 列は、1% の有意水準で、統計的検定によりランダムであるとして受容された 2 値系列の数を表します。B 列は、1% の有意水準で、統計的検定によりランダムでないとして棄却された 2 値系列の数を表します。C 列と D 列は、それぞれ、1% の有意水準で統計的検定に合格した 2 値系列の割合と、それに対応する起こりやすさを表します。最後に、E 列は P 値を表し、これは、その失敗数以上の失敗数が観測される確率に対応します。