NIST IR 7007 日本語訳
英語タイトル : An Overview of Issues in Testing Intrusion Detection Systems日本語タイトル : 侵入検知システムの試験における課題の概観
公開日 : 2003-07-11
原文URL : https://csrc.nist.gov/pubs/ir/7007/final
翻訳編集 : 自動生成(有志による非公式の日本語訳), 原文取得日 : 2026-10-31, 訳文 : 155 / 155 ブロック
[要約] NIST IR 7007 は、侵入検知システム(IDS)の有効性を試験するための方法論をめぐる課題を概観した論文で、NIST と MIT Lincoln Laboratory の著者が執筆しています。本稿は、IDS について定量的に測定できる特性として、カバレッジ、誤警報の確率、検知の確率、IDS を標的とする攻撃への耐性などを挙げ、望まれる性能測定の種類を検討しています。過去の IDS 試験の取り組みとして、University of California at Davis、IBM Zurich、MIT Lincoln Laboratory などによる評価をレビューしています。そのうえで、攻撃スクリプトと被害ソフトウェアの収集の困難や、バックグラウンドトラフィックの扱いといった試験上の課題を論じ、共有データセットや攻撃のトレースなど、IDS 試験の研究に関する推奨事項を示しています。
NISTIR 7007
NISTIR 7007
An Overview of Issues in Testing Intrusion Detection Systems1
侵入検知システムの試験における課題の概観1
Authors: National Institute of Standards and Technology ITL: Peter Mell, Vincent Hu, Massachusetts Institute of Technology Lincoln Laboratory: Richard Lippmann, Josh Haines, Marc Zissman
著者: National Institute of Standards and Technology ITL: Peter Mell, Vincent Hu、Massachusetts Institute of Technology Lincoln Laboratory: Richard Lippmann, Josh Haines, Marc Zissman
Abstract
概要
While intrusion detection systems are becoming ubiquitous defenses in today's networks, currently we have no comprehensive and scientifically rigorous methodology to test the effectiveness of these systems. This paper explores the types of performance measurements that are desired and that have been used in the past. We review many past evaluations that have been designed to assess these metrics. We also discuss the hurdles that have blocked successful measurements in this area and present suggestions for research directed toward improving our measurement capabilities.
侵入検知システムは、今日のネットワークでどこにでもある防御手段になりつつありますが、現在のところ、これらのシステムの有効性を試験するための包括的で科学的に厳密な方法論はありません。本稿では、望まれる性能測定の種類と、過去に用いられてきた性能測定の種類を検討します。これらの指標を評価するために設計された過去の多くの評価をレビューします。また、この分野での測定の成功を妨げてきた障害について論じ、測定能力の向上を目指す研究への提案を示します。
Keywords: intrusion, detection, evaluation, detection, false alarm, false positive, vulnerability, attack, ROC, stealthy, traffic
キーワード: intrusion, detection, evaluation, detection, false alarm, false positive, vulnerability, attack, ROC, stealthy, traffic
1.0 Introduction
1.0 はじめに
Within the last four years, the use of commercial intrusion detection system (IDS) technology has grown considerably, and IDSs are now standard equipment for large networks. According to International Data Corp., the projected revenue from IDSs and related services is expected to rise to $443.5 million in the year 2002 from an estimated $350 million in IDS revenue realized in 2001 [1]. Despite this enormous investment in IDS technology, no comprehensive and scientifically rigorous methodology is available today to test the effectiveness of these systems. Some might blame consumers for not demanding such effectiveness measures before purchasing IDSs. Some might also blame research-funding entities for not investing more money in this area. DARPA, which does fund research in measurement methodologies, is the exception. However, quantitative IDS performance measurements are not available because there are research hurdles that must be overcome before we can create such tests. This paper outlines the quantitative measurements that we need, the obstacles that are impeding progress to developing these measurements, and our ideas for research in IDS performance measurement methodology to overcome those obstacles.
過去 4 年間で、商用の侵入検知システム(IDS)技術の利用は大きく増え、IDS は現在、大規模ネットワークの標準的な機器になっています。International Data Corp. によると、IDS と関連サービスの予測収益は、2001 年に実現した IDS 収益の推定 3 億 5,000 万ドルから、2002 年には 4 億 4,350 万ドルに増加すると見込まれています [1]。IDS 技術にこれほど巨額の投資が行われているにもかかわらず、これらのシステムの有効性を試験するための包括的で科学的に厳密な方法論は、現在のところ存在しません。IDS を購入する前にそのような有効性の指標を求めない消費者に責任があると考える人もいるかもしれません。研究資金を提供する機関がこの分野にもっと投資していないことを非難する人もいるかもしれません。測定方法論の研究に資金を提供している DARPA は例外です。しかし、定量的な IDS の性能測定が得られないのは、そのような試験を作る前に克服しなければならない研究上の障害があるためです。本稿では、必要な定量的測定、これらの測定の開発の進展を妨げている障害、およびそれらの障害を克服するための IDS 性能測定方法論の研究に関する私たちの考えを概説します。
2.0 Motivations for Quantitative Evaluations
2.0 定量的評価の動機
There are many potential customers for the results of quantitative evaluations of IDS accuracy. Acquisition managers need such information to improve the process of system selection, which is too often based only on the claims of the vendors and limited-scope reviews in trade magazines. Security analysts who review the output of IDSs would like to know the likelihood that alerts will result when particular kinds of attacks are initiated. Finally, R&D program managers need to understand the strengths and weaknesses of currently available systems so that they can effectively focus research efforts on improving systems, and measure their progress.
IDS の精度に関する定量的評価の結果を必要とする潜在的な顧客は数多くいます。調達管理者は、システムを選定するプロセスを改善するためにそのような情報を必要としています。現状の選定は、ベンダーの主張と、業界誌の限られた範囲のレビューだけに基づくことがあまりにも多くあります。IDS の出力をレビューするセキュリティアナリストは、特定の種類の攻撃が開始されたときに警報が出る可能性を知りたいと考えています。最後に、研究開発プログラムの管理者は、研究の取り組みをシステムの改善に効果的に集中させ、その進捗を測定できるように、現在利用できるシステムの長所と短所を理解する必要があります。
3.0 Quantitatively Measurable IDS Characteristics
3.0 定量的に測定できる IDS の特性
In this section we list a partial set of measurements that can be made on IDSs. We focus specifically upon those measurements that are quantitative and that relate to detection accuracy.
この節では、IDS に対して行うことができる測定の一部を挙げます。特に、定量的であり、検知精度に関係する測定に焦点を当てます。
3.1 Coverage
3.1 カバレッジ
This measurement determines which attacks an IDS can detect under ideal conditions. For signature-based systems, this would simply consist of counting the number of signatures and mapping them to a standard naming scheme. For non-signature based systems, one would need to determine which attacks out of the set of all known attacks could be detected by a particular methodology. The number of dimensions that make up each attack makes this measurement difficult. Each attack has a particular goal (e.g. denial of service, penetration, or scanning), works against particular software running on particular versions of an operating systems or against a particular protocol, and leaves evidence or a trace in different locations. Attacks may also depend upon the hardware of the system that is attacked, on the version of a protocol used, or on the mode of operation used (e.g. stealthiness techniques). Researchers emphasize a variety of different features in their measurement studies including: the attack goal; the victim type’ the data that must be collected to obtain evidence of the attack; whether the attack uses stealthy IDS evasion techniques; and combinations of these features. The result is that some researchers define attacks with coarse granularity (and acknowledge that each attack has multiple targets and modes of operation), while others define attacks at the finest level of granularity (where each attack has a very specific target configuration and mode of operation). This disparity concerning the proper level of granularity for viewing attacks makes it difficult to count the number of attacks that an IDS detects and to compare the coverage of multiple IDSs. This problem is somewhat alleviated by the Common Vulnerabilities and Exposures (CVE), which is a standard list of virtually all known vulnerabilities [2]. However, the CVE approach does not solve this problem when multiple attacks are used to exploit the same vulnerability using different approaches to evade IDS systems. To address this issue, the CVE standards group has started a project to name attacks, but this work is still in the research stages.
この測定は、理想的な条件のもとで IDS がどの攻撃を検知できるかを判定します。シグネチャベースのシステムでは、これは単に、シグネチャの数を数え、標準的な命名体系に対応付けることになります。シグネチャベースではないシステムでは、既知のすべての攻撃の集合のうち、どの攻撃を特定の方法論で検知できるかを判定する必要があります。各攻撃を構成する次元の数が多いため、この測定は困難です。各攻撃には特定の目的(例: サービス拒否、侵入、スキャン)があり、特定のバージョンのオペレーティングシステム上で動作する特定のソフトウェアに対して、または特定のプロトコルに対して作用し、さまざまな場所に証拠や痕跡を残します。攻撃は、攻撃対象のシステムのハードウェア、使用されるプロトコルのバージョン、または使用される動作モード(例: ステルス技法)にも依存することがあります。研究者は、測定研究において、攻撃の目的、被害対象の種類、攻撃の証拠を得るために収集しなければならないデータ、攻撃がステルス型の IDS 回避技法を使うかどうか、およびこれらの特徴の組合せなど、さまざまな特徴を重視しています。その結果、攻撃を粗い粒度で定義する(各攻撃が複数の標的と動作モードを持つことを認める)研究者もいれば、最も細かい粒度で定義する(各攻撃が非常に具体的な標的構成と動作モードを持つ)研究者もいます。攻撃をどの粒度で捉えるのが適切かについてのこの不一致のため、IDS が検知する攻撃の数を数えたり、複数の IDS のカバレッジを比較したりすることが困難になっています。この問題は、事実上すべての既知の脆弱性の標準リストである Common Vulnerabilities and Exposures(CVE)によって、いくらか緩和されています [2]。しかし、IDS を回避するために異なる手法を用いて、複数の攻撃が同じ脆弱性を悪用する場合には、CVE の手法でもこの問題は解決しません。この問題に対処するため、CVE の標準化グループは攻撃に名前を付けるプロジェクトを開始しましたが、この作業はまだ研究段階にあります。
Another problem with assessing the coverage of attacks is determining the importance of different attack types. Different sites may assign widely varying costs and importance to detecting different types of attacks. Managers of E-commerce sites may not be interested in detecting and analyzing a scan or surveillance attacks that are used to determine hosts and other resources on a network. Often these attacks have no effect on their business and often can not be prevented. E-commerce managers, however may be very interested in detecting the onset of distributed denial of service (DDoS) attacks and in detecting successful host compromises or web defacements. This emphasis is differs from the approach of many commercial evaluations that include many probe and surveillance attacks. Military sites, however, may pay a great deal of attention to surveillance attacks in an attempt to determine precursors to more serious threats.
攻撃のカバレッジを評価するうえでのもう 1 つの問題は、攻撃の種類ごとの重要度を判断することです。サイトによって、さまざまな種類の攻撃の検知に割り当てるコストや重要度は大きく異なる場合があります。E コマースサイトの管理者は、ネットワーク上のホストやその他のリソースを特定するために使われるスキャン攻撃または偵察攻撃の検知・分析に関心がないかもしれません。これらの攻撃は事業に影響しないことが多く、防止できないこともよくあります。しかし、E コマースの管理者は、分散型サービス拒否(DDoS)攻撃の開始や、ホストの侵害または Web の改ざんが成功したことの検知には大きな関心を持つかもしれません。この重点の置き方は、多数のプローブ攻撃や偵察攻撃を含む多くの商用評価とは異なります。一方、軍のサイトは、より深刻な脅威の前兆を見極めるために、偵察攻撃に細心の注意を払うことがあります。
In addition, most sites are not able to detect failed attacks seeking vulnerabilities that no longer exist on a site. Attacks may fail because operating systems have been patched and are no longer vulnerable to specific attacks, because systems with the required operating system do not exist, or because a firewall or other protective device blocks important attack components. A particular site may monitor only a few out of the thousands of current known vulnerabilities listed in the CVE, and those few will change as systems are replaced, patched, and reconfigured and as new vulnerabilities are discovered. A comprehensive evaluation with hundreds of old attacks that exploit patched vulnerabilities may not be applicable to a site running well maintained web servers. A more focused evaluation including the five most recent web and DNS attacks may be more suitable.
加えて、ほとんどのサイトは、そのサイトにもはや存在しない脆弱性を狙った失敗した攻撃を検知できません。攻撃が失敗する理由としては、オペレーティングシステムにパッチが適用されて特定の攻撃に対して脆弱でなくなったこと、必要なオペレーティングシステムを備えたシステムが存在しないこと、ファイアウォールやその他の防護装置が攻撃の重要な構成要素を阻止したことがあります。特定のサイトが監視するのは、CVE に挙げられている現在知られている数千の脆弱性のうち、ごくわずかにすぎない場合があり、その数少ない脆弱性も、システムの入れ替え、パッチ適用、再構成、そして新たな脆弱性の発見に伴って変わります。パッチ適用済みの脆弱性を悪用する何百もの古い攻撃を含む包括的な評価は、よく保守された Web サーバーを運用しているサイトには当てはまらないかもしれません。直近の Web 攻撃と DNS 攻撃 5 件を含む、より焦点を絞った評価の方が適しているかもしれません。
3.2 Probability of False Alarms
3.2 誤警報の確率
This measurement determines the rate of false positives produced by an IDS in a given environment during a particular time frame. A false positive or false alarm is an alert caused by normal non-malicious background traffic. Some causes for Network IDS (NIDS) include weak signatures that: alert on all traffic to a high-numbered port used by a backdoor; search for the occurrence of a common word such as “help” in the first 100 bytes of SNMP or other TCP connections; or detect common violations of the TCP protocol. They can also be caused by normal network monitoring and maintenance traffic generated by network management tools. It is difficult to measure false alarms because an IDS may have a different false positive rate in each network environment and there is no such thing as a “standard” network. Also, it is difficult to determine aspects of network traffic or host activity that will cause false alarms. As a result, it may be difficult to guarantee that we can produce the same number and type of false alarms in an IDS test as are found in real networks. Lastly, IDSs can be configured and tuned in a variety of ways in order to reduce the false positive rate. This makes it difficult to determine which configuration of an IDS should be used for a particular false positive test.
この測定は、特定の期間に特定の環境で IDS が生じる偽陽性の率を判定します。偽陽性または誤警報は、悪意のない通常のバックグラウンドトラフィックによって引き起こされる警報です。ネットワーク IDS(NIDS)では、原因の一部として、次のような弱いシグネチャがあります。バックドアが使用する大きな番号のポートへのすべてのトラフィックで警報を出すもの、SNMP やその他の TCP 接続の最初の 100 バイトに “help” のような一般的な単語が現れるかどうかを検索するもの、TCP プロトコルの一般的な違反を検知するものです。また、ネットワーク管理ツールが生成する通常のネットワーク監視・保守トラフィックによっても引き起こされることがあります。IDS の偽陽性率はネットワーク環境ごとに異なる場合があり、「標準的な」ネットワークというものは存在しないため、誤警報を測定するのは困難です。また、誤警報を引き起こすネットワークトラフィックやホスト活動の側面を判定することも困難です。その結果、IDS の試験で、実際のネットワークで見られるのと同じ数と種類の誤警報を生じさせられることを保証するのは困難な場合があります。最後に、IDS はさまざまな方法で設定・調整して偽陽性率を下げることができます。このため、特定の偽陽性試験にどの IDS の構成を使うべきかを判断することが困難になります。
A Receiver Operating Characteristic Curve is an aggregate of the probability of false alarms and the probability of detection measurements. We mention it because of its importance in the IDS testing community. This curve summarizes the relationship between two of the most important IDS characteristics: false positive and detection probability. In Figure 1, we show a receiver operating characteristic (ROC) curve produced by two systems in an IDS test. The x axis shows the percentage of false alarms produced during a test and the y axis shows the percent of detected attacks at any given false alarm percentage. Note that an IDS can be operated at any given point on the curve. In this example, system 1 can be tuned to a variety of operating points while system 2 would be difficult to configure because it has only one realistic operating point. By definition, a receiver operating characteristic curve shows probabilities on the x and y axes, but sometimes the unit of measurement for normal traffic is difficult to define. As a result, researchers have used false alarms per unit time on the x axis. A unit of measurement is required to determine the maximum number of false alarms that could occur over a given time period. This unit of measurement depends critically on how features are extracted in an IDS from the input data used and is difficult to determine for commercial IDSs and other black-box systems. For evaluation purposes, it is probably better to plot detection rate versus false alarms per unit time. These curves are not truly ROC curves, but they convey information of importance when analyzing and comparing IDSs. In Figure 1, both systems were network-based IDSs, and the unit of measurement was the total number of packets transmitted over the network. The analysis assumed that, at worst, an IDS could issue one alert per packet, and the maximum number of alerts was the total number of packets transmitted.
受信者動作特性曲線(Receiver Operating Characteristic Curve)は、誤警報の確率と検知の確率の測定を集約したものです。IDS の試験コミュニティで重要であるため、ここで触れておきます。この曲線は、IDS の最も重要な特性の一部である、偽陽性と検知確率の関係をまとめたものです。図 1 に、IDS の試験で 2 つのシステムが生成した受信者動作特性(ROC)曲線を示します。x 軸は試験中に生じた誤警報の割合を、y 軸は、ある誤警報の割合における検知された攻撃の割合を示します。IDS は、曲線上のどの点でも運用できることに注意してください。この例では、システム 1 はさまざまな動作点に調整できますが、システム 2 は現実的な動作点が 1 つしかないため、設定が困難でしょう。定義上、受信者動作特性曲線は x 軸と y 軸に確率を示しますが、通常のトラフィックの測定単位を定義するのが困難な場合もあります。その結果、研究者は x 軸に単位時間あたりの誤警報を使ってきました。ある期間に生じ得る誤警報の最大数を判定するには、測定単位が必要です。この測定単位は、IDS が使用する入力データから特徴をどのように抽出するかに決定的に依存し、商用 IDS やその他のブラックボックスのシステムでは判定が困難です。評価の目的では、検知率を単位時間あたりの誤警報に対してプロットする方がおそらく良いでしょう。これらの曲線は厳密には ROC 曲線ではありませんが、IDS を分析・比較する際に重要な情報を伝えます。図 1 では、両方のシステムがネットワーク型 IDS であり、測定単位はネットワーク上で送信されたパケットの総数でした。分析では、IDS は最悪の場合 1 パケットにつき 1 件の警報を出し得るものとし、警報の最大数は送信されたパケットの総数であるとしました。
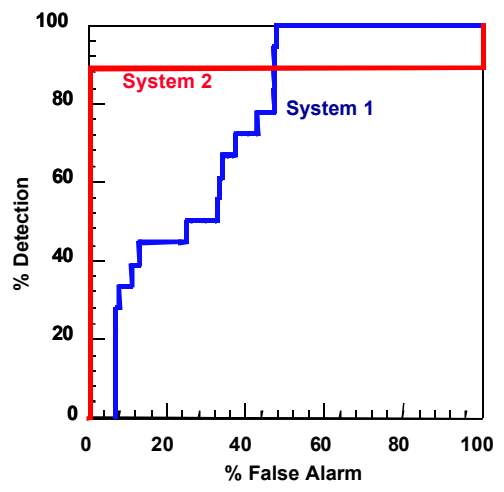
階段状の折れ線グラフ(ROC 曲線)です。縦軸は「% Detection」(検知率 %)で、0〜100 に「0」「20」「40」「60」「80」「100」の目盛りがあり、横軸は「% False Alarm」(誤警報率 %)で、0〜100 に「0」「20」「40」「60」「80」「100」の目盛りがあります。赤い線「System 2」(システム 2)は誤警報率 0% で検知率約 89% まで垂直に上がり、そのまま誤警報率 100% まで水平に進み、そこで 100 まで上がります。青い階段状の線「System 1」(システム 1)は誤警報率約 7% から始まり、約 7〜48% の間で検知率が段階的に(約 28、33、39、45、50、67、72、78%)上がり、誤警報率約 48% で検知率 100% に跳ね上がって、その後は 100 のままです。
Figure 1. Receiver operating characteristic (ROC) curve plotting the percentage attacks detected versus the percentage of false alarms.
図 1. 検知した攻撃の割合と誤警報の割合をプロットした受信者動作特性(ROC)曲線
An interesting aspect of ROC curves is that there is an optimal operating point for an IDS, given a particular network being monitored. However, to determine it, one must know the cost of a false alarm, the value of a correct detection, and the prior probabilities of normal and attack traffic.
ROC 曲線の興味深い点は、監視対象の特定のネットワークに対して、IDS の最適な動作点が存在することです。ただし、それを判定するには、誤警報のコスト、正しい検知の価値、および通常トラフィックと攻撃トラフィックの事前確率を知っている必要があります。
3.3 Probability of Detection
3.3 検知の確率
This measurement determines the rate of attacks detected correctly by an IDS in a given environment during a particular time frame. The difficulty in measuring the detection rate is that the success of an IDS is largely dependent upon the set of attacks used during the test. Also, the probability of detection varies with the false positive rate, and an IDS can be configured or tuned to favor either the ability to detect attacks or to minimize false positives (see section 3.2 for an explanation of this). One must be careful to use the same configuration during testing for false positives and hit rates.
この測定は、特定の期間に特定の環境で IDS が正しく検知した攻撃の率を判定します。検知率の測定が難しいのは、IDS の成否が、試験で使われる攻撃の集合に大きく依存するためです。また、検知の確率は偽陽性率とともに変動し、IDS は、攻撃を検知する能力を優先するか、偽陽性を最小化するかのどちらかに偏るよう設定・調整できます(これについての説明は第 3.2 節を参照)。偽陽性の試験とヒット率の試験では、同じ構成を使うよう注意しなければなりません。
Further, an NIDS can be evaded by stealthy versions of attacks. An NIDS may detect an attack when it is launched in a simple straightforward manner, but not when even simple approaches to stealthiness are used. Techniques used to make attacks stealthy include fragmenting packets, using various types of data encoding, using unusual TCP flags, encrypting attack packets, spreading attacks over multiple network sessions, and launching attacks from multiple sources [3, 4].
さらに、NIDS は、ステルス版の攻撃によって回避される場合があります。NIDS は、攻撃が単純で直接的な方法で仕掛けられたときには検知できても、単純なステルス手法が使われただけで検知できないことがあります。攻撃をステルス化するために使われる技法には、パケットの断片化、さまざまな種類のデータ符号化の使用、異常な TCP フラグの使用、攻撃パケットの暗号化、複数のネットワークセッションにまたがる攻撃の分散、複数の発信元からの攻撃の開始があります [3, 4]。
3.4 Resistance to Attacks Directed at the IDS
3.4 IDS を標的とする攻撃への耐性
This measurement demonstrates how resistant an IDS is to an attacker's attempt to disrupt the correct operation of the IDS. Attacks against an IDS may take the form of:
この測定は、IDS の正しい動作を妨害しようとする攻撃者の試みに対し、IDS がどれだけ耐えられるかを示します。IDS に対する攻撃は、次のような形をとる場合があります。
1.Sending a large amount of non-attack traffic with volume exceeding the IDS’s processing capability. With too much traffic to process, an IDS may drop packets and be unable to detect attacks.
1.IDS の処理能力を超える量の、攻撃ではないトラフィックを大量に送ります。処理すべきトラフィックが多すぎると、IDS はパケットを破棄し、攻撃を検知できなくなる場合があります。
2.Sending to the IDS non-attack packets that are specially crafted to trigger many signatures within the IDS, thereby overwhelming the IDS’s human operator with false positives or crashing alert processing or display tools.
2.IDS 内の多くのシグネチャを作動させるよう特別に細工した、攻撃ではないパケットを IDS に送り、IDS の人間のオペレーターを偽陽性で圧倒するか、警報の処理ツールや表示ツールをクラッシュさせる。
3.Sending to the IDS a large number of attack packets intended to distract the IDS’s human operator while the attacker instigates a real attack hidden under the “smokescreen” created by the multitude of other attacks.
3.IDS の人間のオペレーターの注意をそらすことを意図した大量の攻撃パケットを IDS に送り、その間に、他の多数の攻撃が作り出す「煙幕」に隠れて、攻撃者が本物の攻撃を仕掛けます。
4.Sending to the IDS packets containing data that exploit a vulnerability within the IDS processing algorithms . Such attacks will only be successful if the IDS contains a known coding error that can be exploited by a clever attacker. Fortunately, very few IDSs have had known exploitable buffer overflows or other vulnerabilities.
4.IDS の処理アルゴリズム内の脆弱性を悪用するデータを含むパケットを IDS に送ります。このような攻撃は、巧妙な攻撃者が悪用できる既知のコーディング上の誤りが IDS にある場合にのみ成功します。幸いなことに、悪用可能なバッファオーバーフローやその他の脆弱性が知られている IDS は、ごくわずかです。
3.5 Ability to Handle High Bandwidth Traffic
3.5 高帯域幅トラフィックの処理能力
This measurement demonstrates how well an IDS will function when presented with a large volume of traffic. Most network-based IDSs will begin to drop packets as the traffic volume increases, thereby causing the IDS to miss a percentage of the attacks. At a certain threshold, most IDSs will stop detecting any attacks. This measurement is almost identical to the “resistance to denial of service measurement” when the attacker sends a large amount of non-attack traffic to the IDS. The only difference is that this measurement calculates the ability of the IDS to handle particular volumes of normal background traffic.
この測定は、大量のトラフィックが与えられたときに IDS がどれだけうまく機能するかを示します。ほとんどのネットワーク型 IDS は、トラフィック量が増えるとパケットを破棄し始め、その結果、一定の割合の攻撃を見逃します。ある閾値に達すると、ほとんどの IDS はどの攻撃も検知しなくなります。この測定は、攻撃者が攻撃ではないトラフィックを大量に IDS に送る場合の「サービス拒否への耐性の測定」とほぼ同じです。唯一の違いは、この測定が、特定の量の通常のバックグラウンドトラフィックを処理する IDS の能力を算出する点です。
3.6 Ability to Correlate Events
3.6 イベントの相関付けの能力
This measurement demonstrates how well an IDS correlates attack events. These events may be gathered from IDSs, routers, firewalls, application logs, or a wide variety of other devices. One of the primary goals of this correlation is to identify staged penetration attacks. Currently, IDSs have only limited capabilities in this area.
この測定は、IDS が攻撃イベントをどれだけうまく相関付けるかを示します。これらのイベントは、IDS、ルーター、ファイアウォール、アプリケーションログ、またはその他の幅広いデバイスから収集されることがあります。この相関付けの主要な目的の 1 つは、段階的な侵入攻撃を特定することです。現在のところ、この分野での IDS の能力は限られています。
3.7 Ability to Detect Never Before Seen Attacks
3.7 これまで確認されていない攻撃の検知能力
This measurement demonstrates how well an IDS can detect attacks that have not occurred before. For commercial systems, it is generally not useful to take this measurement since their signature-based technology can only detect attacks that had occurred previously (with a few exceptions). However, research systems based on anomaly detection or specification-based approaches may be suitable for this type of measurement. Usually systems detecting attacks that had never been detected before produce more false positives than those that do not have this feature.
この測定は、IDS が、これまでに発生したことのない攻撃をどれだけうまく検知できるかを示します。商用システムは、シグネチャベースの技術では以前に発生した攻撃しか検知できない(少数の例外を除く)ため、一般にこの測定を行っても有用ではありません。しかし、異常検知や仕様ベースの手法に基づく研究システムは、この種の測定に適しているかもしれません。通常、これまで検知されたことのない攻撃を検知するシステムは、この機能を持たないシステムよりも偽陽性が多くなります。
3.8 Ability to Identify an Attack
3.8 攻撃の識別能力
This measurement demonstrates how well an IDS can identify the attack that it has detected by labeling each attack with a common name or vulnerability name or by assigning the attack to a category.
この測定は、IDS が検知した攻撃を、一般的な名称や脆弱性名で標識付けしたり、攻撃をカテゴリに割り当てたりすることで、どれだけうまく識別できるかを示します。
3.9 Ability to Determine Attack Success
3.9 攻撃の成否の判定能力
This measurement demonstrates if the IDS can determine the success of attacks from remote sites that give the attacker higher-level privileges on the attacked system. In current network environments, many remote privilege-gaining attacks (or probes) fail and do not damage the system attacked. Many IDSs, however, do not distinguish the failed from the successful attacks. For the same attack, some IDSs can detect the evidence of damages (whether the attack has succeeded) and some IDSs detect only the signature of attack actions (with no indication whether the attack succeeded or not). The ability to determine attack success is essential for the analysis of the attack correlation and the attack scenario; it also greatly simplifies an analyst’s work by distinguishing between more important successful attacks and the usually less damaging failed attacks. Measuring this capability requires the information about failed attacks as well as successful attacks.
この測定は、IDS が、攻撃対象のシステムで攻撃者により高い権限を与える遠隔サイトからの攻撃の成否を判定できるかどうかを示します。現在のネットワーク環境では、遠隔から権限を獲得する多くの攻撃(またはプローブ)は失敗し、攻撃対象のシステムに損害を与えません。しかし、多くの IDS は、失敗した攻撃と成功した攻撃を区別しません。同じ攻撃に対して、損害の証拠(攻撃が成功したかどうか)を検知できる IDS もあれば、攻撃行為のシグネチャしか検知しない(攻撃が成功したかどうかは示されない)IDS もあります。攻撃の成否を判定する能力は、攻撃の相関付けや攻撃シナリオの分析に不可欠です。また、より重要な成功した攻撃と、通常は被害がより小さい失敗した攻撃を区別することで、アナリストの作業を大幅に簡素化します。この能力を測定するには、成功した攻撃だけでなく失敗した攻撃に関する情報も必要です。
3.10 Capacity Verification for NIDS
3.10 NIDS の容量の検証
The NIDS demands higher-level protocol awareness than other network devices such as switches and routers; it has the ability of inspection into the deeper level of network packets. Therefore, it is important to measure the ability of a NIDS to capture, process and perform at the same level of accuracy under a given network load as it does on a quiescent network. For example, Hall [34] has proposed a test methodology and traffic metrics for standardized capacity benchmarking of NIDS. The NIDS customers can then use the standardized capacity test results for each metric and a profile of their networks to determine if the NIDS is even capable of sustaining inspection of the traffic.
NIDS は、スイッチやルーターなどの他のネットワーク機器よりも高い水準のプロトコルの認識を必要とし、ネットワークパケットのより深い階層まで検査する能力を持ちます。したがって、NIDS が、与えられたネットワーク負荷のもとで、静穏なネットワークの場合と同じ水準の精度でパケットを捕捉し、処理し、動作する能力を測定することが重要です。たとえば Hall [34] は、NIDS の容量を標準化してベンチマークするための試験方法論とトラフィック指標を提案しています。NIDS の顧客は、各指標についての標準化された容量試験の結果と、自らのネットワークのプロファイルを使って、NIDS がそのトラフィックの検査を持続できる能力を備えているかどうかを判断できます。
3.11 Other Measurements
3.11 その他の測定
There are other measurements, such as ease of use, ease of maintenance, deployments issues, resource requirements, availability and quality of support etc. These measurements are not directly related to the IDS performance but may be more significant in many commercial situations.
使いやすさ、保守のしやすさ、導入上の問題、リソース要件、サポートの可用性と品質など、その他の測定もあります。これらの測定は IDS の性能に直接は関係しませんが、多くの商用の状況ではより重要になる場合があります。
4.0 Existing IDS Testing Efforts
4.0 既存の IDS 試験の取り組み
IDS testing efforts vary significantly in their depth, scope, methodology, and focus. Table 1 summarizes the characteristics of some of the more developed efforts listed in chronological order. This table demonstrates that evaluations have increased in complexity over time to include more IDSs and more attack types, such as stealthy and denial of service (DoS) attacks. Only research evaluations have included novel attacks designed specifically for the evaluation, evaluated the performance of anomaly detection systems, and generated ROC curves. Evaluations of commercial systems have included measurements of performance under high traffic loads. Traffic loads were generated using real high-volume background traffic mirrored from a live network and also with commercial load-testing tools. The remainder of this section provides details concerning all the evaluations shown in Table 1, as well as for a few other more limited evaluations. Evaluations of research systems are described first, followed by descriptions of commercial system evaluations.
IDS の試験の取り組みは、深さ、範囲、方法論、重点においてかなり異なります。表 1 は、より進んだ取り組みのいくつかについて、その特徴を時系列順にまとめたものです。この表は、評価が時とともに複雑さを増し、より多くの IDS と、ステルス攻撃やサービス拒否(DoS)攻撃など、より多くの攻撃の種類を含むようになったことを示しています。評価のために特別に設計された新規の攻撃を含め、異常検知システムの性能を評価し、ROC 曲線を生成したのは、研究目的の評価だけです。商用システムの評価には、高いトラフィック負荷のもとでの性能の測定が含まれています。トラフィック負荷は、実際のネットワークからミラーリングした実際の大量のバックグラウンドトラフィックと、商用の負荷試験ツールの両方を使って生成されました。この節の残りでは、表 1 に示したすべての評価と、他のいくつかのより限定的な評価について、詳細を説明します。まず研究システムの評価を説明し、その後に商用システムの評価を説明します。
4.1 University of California at Davis (UCD)
4.1 University of California at Davis(UCD)
Early research efforts at the University of California at Davis led to the first IDS testing platform that automatically launched attacks using interactive telnet, FTP, and rlogin sessions [5]. Scripts of normal and attack sessions were launched during tests that evaluated that ability of an IDS to distinguish intrusions from normal behavior and to operate when the computer running the IDS was under high load. An early network intrusion detection system called the Network Security Monitor (NSM) [6], which uses keyword matching to detect attacks in network traffic, was evaluated. The evaluation used a few attacks including password guessing, transmitting a password file to a remote host, and exploiting a vulnerability in the load module program to obtain super user status on a Unix machine. NSM missed some of these attacks until additional keywords were added. Under high CPU loads, it dropped packets and did not successfully detect attacks.
University of California at Davis での初期の研究の取り組みから、対話型の telnet、FTP、rlogin のセッションを用いて攻撃を自動的に仕掛ける最初の IDS 試験プラットフォームが生まれました [5]。IDS が侵入と通常の動作を区別する能力と、IDS を実行するコンピュータが高負荷のもとにあるときにも動作する能力を評価する試験の間に、通常のセッションと攻撃セッションのスクリプトが実行されました。ネットワークトラフィック中のキーワード照合によって攻撃を検知する、Network Security Monitor(NSM)[6] という初期のネットワーク型侵入検知システムが評価されました。この評価では、パスワードの推測、パスワードファイルのリモートホストへの送信、Unix マシンでスーパーユーザー権限を得るためのロードモジュールプログラムの脆弱性の悪用など、少数の攻撃が使われました。NSM は、キーワードが追加されるまで、これらの攻撃の一部を見逃しました。CPU 負荷が高い状態では、パケットを破棄し、攻撃を検知できませんでした。
4.2 IBM Zurich
4.2 IBM Zurich
A similar IDS testing platform, not included in Table 1 (detail data not available), was developed at the IBM Zurich Research Laboratory to support IDS research [7]. Automated attacks and background traffic were generated as in [5] and used to improve IDS systems that were designed to detect attacks against FTP servers. Background traffic was generated only for FTP servers, and a small number of FTP attacks were scripted. It was noted that initial low detection and high false alarm rates were improved by cyclical repeatable testing and that generating realistic normal background traffic was complex and time-consuming. A focus of this effort was an attempt to completely automate the tasks required to run an evaluation.
表 1 には含まれていない(詳細データは入手できません)同様の IDS 試験プラットフォームが、IDS の研究を支援するため、IBM Zurich Research Laboratory で開発されました [7]。[5] と同様に、自動化された攻撃とバックグラウンドトラフィックが生成され、FTP サーバーに対する攻撃を検知するよう設計された IDS システムの改善に使われました。バックグラウンドトラフィックは FTP サーバーについてのみ生成され、少数の FTP 攻撃がスクリプト化されました。当初の低い検知率と高い誤警報率は、繰り返し可能な試験を周期的に行うことで改善されたこと、そして現実的な通常のバックグラウンドトラフィックの生成は複雑で時間がかかることが指摘されました。この取り組みの焦点は、評価の実施に必要な作業を完全に自動化する試みでした。
4.3 MIT Lincoln Laboratory (MIT/LL)
4.3 MIT Lincoln Laboratory(MIT/LL)
MIT/LL has performed the most extensive quantitative IDS testing to date. Sponsored by the Department of Defense Advanced Research Projects Agency (DARPA), MIT/LL conducted large-scale testing of research IDSs in 1998 and 1999 [8, 9, 10]. The 1999 evaluation effort used a test bed, which generated live background traffic similar to that on an Air Force base containing hundreds of users on thousands of hosts. More than 200 instances of 58 attack types (including stealthy and novel attacks) were embedded in seven weeks of training data and two weeks of test data. Different from their 1998 evaluation, the 1999 evaluation was designed primarily to measure the ability of systems to detect new attacks without first training on instances of these attacks. Automated attacks were launched against three UNIX victim machines (SunOS, Solaris, Linux), Windows NT hosts, and a router in the presence of background traffic. Detection rates for attacks, false alarm rates for background traffic, and ROC curves were generated for more than 18 research IDS systems and attack categories including DoS, probe, remote-to-local, and user-to-super-user attacks. Attacks were counted as detected if an IDS produced an alert for the attacked machine that indicated traffic or actions on a victim host generated by the attack. An analysis of attack identification was also performed to determine if IDSs could provide the correct name for old attacks and attack details including the IP source address, ports used, and beginning and end of the attack. In addition, detailed analyses of detections and high-scoring false alarms were performed for a smaller number of high-performance systems to determine why specific attacks were missed. Results demonstrated that a combination of network and host-based approaches would have provided the best attack coverage. Also, novel attacks are difficult to detect because signatures do not generalize to new attacks and because network protocols or host audit logs were not analyzed sufficiently to extract attack evidence. Systems that detected old attacks could provide the correct names for these attacks and provide accurate information on the attack source, protocols, and ports used.
MIT/LL は、これまでで最も広範な定量的 IDS 試験を実施してきました。MIT/LL は、国防総省国防高等研究計画局(DARPA)の資金提供を受け、1998 年と 1999 年に研究目的の IDS の大規模な試験を実施しました [8, 9, 10]。1999 年の評価の取り組みでは、数千のホスト上の数百人の利用者を抱える空軍基地のトラフィックに似た、実際のバックグラウンドトラフィックを生成するテストベッドを使いました。58 種類の攻撃の 200 を超える事例(ステルス攻撃や新規の攻撃を含む)が、7 週間の訓練データと 2 週間の試験データに埋め込まれました。1998 年の評価とは異なり、1999 年の評価は、新しい攻撃の事例について事前に訓練することなく、システムがそれらの攻撃を検知する能力を測定することを主な目的として設計されました。バックグラウンドトラフィックが存在する状況で、3 台の UNIX 被害マシン(SunOS、Solaris、Linux)、Windows NT ホスト、およびルーターに対して、自動化された攻撃が仕掛けられました。DoS、プローブ、リモートからローカルへ、ユーザーからスーパーユーザーへの攻撃などのカテゴリについて、18 を超える研究目的の IDS システムの攻撃の検知率、バックグラウンドトラフィックの誤警報率、ROC 曲線が生成されました。攻撃は、IDS が、その攻撃によって被害ホスト上で生じたトラフィックまたは動作を示す警報を、攻撃されたマシンについて出した場合に、検知されたものとして数えられました。また、IDS が古い攻撃の正しい名称と、攻撃元の IP アドレス、使用されたポート、攻撃の開始と終了などの攻撃の詳細を提供できるかどうかを判定するため、攻撃の識別の分析も行われました。さらに、特定の攻撃が見逃された理由を判定するため、少数の高性能システムについて、検知と高スコアの誤警報の詳細な分析が行われました。結果は、ネットワーク型とホスト型の手法の組合せが最良の攻撃カバレッジをもたらすことを示しました。また、シグネチャは新しい攻撃に一般化できず、ネットワークプロトコルやホストの監査ログが攻撃の証拠を抽出できるほど十分に分析されなかったため、新規の攻撃は検知が困難です。古い攻撃を検知したシステムは、それらの攻撃の正しい名称と、攻撃元、プロトコル、使用されたポートに関する正確な情報を提供できました。
The MIT/LL evaluations resulted in the development of an intrusion detection corpus that includes weeks of background traffic and host audit logs, and hundreds of labeled and documented attacks. This corpus, used extensively by researchers, has been used as part of a data mining competition [11], and was recently posted to a public web site [12]. This data has been used by Anzen Computing [13] to evaluate five commercial IDSs. Network tcpdump packet traces from the MIT/LL corpus were played back on a testbed in real time past commercial products, and truth markings were used to score output alerts. In addition, traffic for a few attacks was modified to determine whether the commercial systems were susceptible to the IDS evasion techniques described in [3]. The best commercial system detected only about half of the 43 attacks used, and three of the five commercial systems were not susceptible to IDS evasion techniques. Recent extensions of the MIT/LL evaluations led to a new corpus containing traffic produced by two complex distributed denial of service attacks and an evaluation testbed entitled LARIAT that automates most of the tasks required for real-time evaluations [14]. A review of the MIT/LL evaluations [15] suggests further extensions including more detailed analyses of reasons for misses and false alarms, development of calibrated sets of background traffic, inclusion of commercial products, and use of many more attacks.
MIT/LL の評価により、数週間分のバックグラウンドトラフィックとホストの監査ログ、そしてラベル付けされ文書化された数百の攻撃を含む侵入検知コーパスが開発されました。このコーパスは研究者に広く利用されており、データマイニングのコンテストの一部としても使われ [11]、最近、公開 Web サイトに掲載されました [12]。このデータは Anzen Computing [13] が 5 つの商用 IDS の評価に使いました。MIT/LL のコーパスのネットワーク tcpdump パケットトレースが、テストベッド上で商用製品に向けてリアルタイムに再生され、出力された警報の採点には正解のマーキングが使われました。加えて、商用システムが [3] に記載された IDS 回避技法の影響を受けやすいかどうかを判定するため、いくつかの攻撃のトラフィックが改変されました。最良の商用システムでも、使用された 43 件の攻撃のうち約半数しか検知できず、5 つの商用システムのうち 3 つは IDS 回避技法の影響を受けませんでした。MIT/LL の評価のその後の拡張により、2 つの複雑な分散型サービス拒否攻撃が生成したトラフィックを含む新しいコーパスと、リアルタイムの評価に必要な作業の大半を自動化する、LARIAT という名称の評価用テストベッドが開発されました [14]。MIT/LL の評価のレビュー [15] は、見逃しと誤警報の原因のより詳細な分析、較正されたバックグラウンドトラフィックの集合の開発、商用製品の追加、はるかに多くの攻撃の使用などのさらなる拡張を示唆しています。
4.4 Air Force Research Laboratory (AFRL)
4.4 Air Force Research Laboratory(AFRL)
AFRL, also under DARPA funding, participated with MIT/LL in the 1998 and 1999 evaluations of research IDS’s. Their approach was similar to MIT/LL (they used some of MIT/LL’s traffic and attack generation software ) but focused upon testing IDSs in real-time in a more complex hierarchical network environment. IDS systems were installed in a testbed, four hours of background traffic were run, and attacks were launched against hosts in the midst of this background traffic. AFRL simulated a large network by developing software (also used by MIT/LL) to dynamically assign arbitrary source IP addresses to individual network sessions running on testbed computers. The 1998 test [16] evaluated three mature research signature-based IDSs and a government off-the-shelf (GOTS) baseline system similar to NSM [6]. Research systems had substantially lower false alarm rates than the GOTS system, but overall attack detection accuracy was still roughly only 25% at acceptable low false alarm rates. Further real-time evaluations were performed in 1999 on the same testbed, but no publications are currently available that describe this work. A summary briefing to DARPA noted that 1999 evaluations included commercial IDS systems, more complex background traffic, and a wider range of attacks and research systems.
AFRL も DARPA の資金提供を受け、研究目的の IDS に関する 1998 年と 1999 年の評価に MIT/LL とともに参加しました。そのアプローチは MIT/LL に似ていました(MIT/LL のトラフィックおよび攻撃生成ソフトウェアの一部を使用しました)が、より複雑な階層型のネットワーク環境で IDS をリアルタイムに試験することに重点を置きました。IDS システムをテストベッドに設置し、4 時間分のバックグラウンドトラフィックを流し、そのバックグラウンドトラフィックの中でホストに対して攻撃が仕掛けられました。AFRL は、テストベッドのコンピュータ上で動作する個々のネットワークセッションに任意の発信元 IP アドレスを動的に割り当てるソフトウェア(MIT/LL も使用)を開発することで、大規模なネットワークを模擬しました。1998 年の試験 [16] では、成熟した研究目的のシグネチャベース IDS 3 つと、NSM [6] に似た政府既製品(GOTS)のベースラインシステムが評価されました。研究システムの誤警報率は GOTS システムより大幅に低かったものの、許容できる低い誤警報率での攻撃検知精度は、全体として依然として約 25% にすぎませんでした。1999 年には同じテストベッドでさらにリアルタイムの評価が行われましたが、この作業を説明する刊行物は現在のところありません。DARPA への要約説明では、1999 年の評価には、商用 IDS システム、より複雑なバックグラウンドトラフィック、より幅広い攻撃と研究システムが含まれていたと述べられました。
4.5 MITRE
4.5 MITRE
The MITRE Corporation [17] hosted the Intrusion Detection Fly-Off, one of the earliest evaluations of commercial and government-developed IDSs. This activity was an investigation into the characteristics and capabilities of network-based IDSs. Seven IDSs were tested using a two-phase approach. Phase I included relatively simple attacks using tools such as SATAN. This phase gave IDS operators an opportunity to familiarize themselves with the IDSs, and gave attackers an opportunity to practice attacking the systems. Phase II was designed to simulate a determined attack, involving both simple and more complex, stealthy attacks. Qualitative results were generated according to the following categories: real-time alerting capabilities; reporting capabilities; off-line analysis capabilities; response capabilities; and remote management system. These analyses revealed weaknesses in the implementation and stability of some of the systems tested. Two of the commercial systems tested detected many more low-level attacks than the three government-developed systems, presumably because they had many more signatures for these attacks. The government-developed systems, however, were better suited to detecting and analyzing high-level attacks performed during interactive sessions. Attackers, given knowledge of the signatures used in the IDSs, were able to create stealthy attacks that were not detected.
MITRE Corporation [17] は、商用および政府開発の IDS に関する最も初期の評価の 1 つである Intrusion Detection Fly-Off を主催しました。この活動は、ネットワーク型 IDS の特性と能力の調査でした。2 段階の手法を用いて 7 つの IDS が試験されました。第 1 段階には、SATAN などのツールを用いた比較的単純な攻撃が含まれていました。この段階は、IDS のオペレーターが IDS に習熟する機会と、攻撃者がシステムへの攻撃を練習する機会を与えました。第 2 段階は、単純な攻撃と、より複雑なステルス攻撃の両方を含む、断固とした攻撃を模擬するよう設計されました。定性的な結果は、リアルタイムの警報能力、報告能力、オフライン分析能力、対応能力、遠隔管理システムの各カテゴリに従って生成されました。これらの分析により、試験されたシステムの一部に、実装と安定性の弱点があることが明らかになりました。試験された商用システムのうち 2 つは、政府開発の 3 つのシステムよりもはるかに多くの低水準の攻撃を検知しました。これは、それらの攻撃に対するシグネチャがはるかに多かったためと考えられます。しかし、政府開発のシステムは、対話型セッション中に行われる高水準の攻撃の検知と分析により適していました。攻撃者は、IDS が使うシグネチャを知っていたため、検知されないステルス攻撃を作ることができました。
4.6 Neohapsis/Network-Computing
4.6 Neohapsis/Network-Computing
Since 1999, Network Computing magazine has sponsored evaluation of commercial intrusion detection products by Neohapsis Laboratories[18-20]. The most recent review [20] included 13 commercial IDSs and the open-source Snort IDS [21]. These reviews assess performance under highly realistic traffic loads and have grown in complexity over the years. Qualitative results focus on practical characteristics including ease-of-use of the management framework, stability, cost effectiveness, signature quality/depth, and ease of customization. Quantitative results include the number of attacks detected [18-20] and sometimes the maximum traffic rates that can be handled before the IDS starts dropping packets, fails to perform signature checking, or fails to reassemble fragmented packets [19]. Table 1 shows characteristics of the most recent evaluation [20]. Realistic background traffic was created by mirroring traffic from DePaul University in Chicago onto an isolated testbed network. This traffic was from a backbone network with roughly 10,000 hosts and traffic rates of 30- to 88-M bits/sec and 5,000 to 7,000 packets per second. The evaluation showed that only seven of the IDSs tested could operate at these high traffic loads and that one crashed after only a few minutes. No careful analysis was made of false alarm rates. Nine recent attacks were launched against eight network IDSs. One detected all nine attacks, two detected only two attacks, and the other six detected from five to eight attacks. Each IDS was scored in the areas of management framework, signature quality/depth, stability of engine, cost-effectiveness, and customization. Detailed tables were also provided for each IDS, including features such as availability of a back-end database API, ability to reassemble fragmented packets and TCP streams, automatic signature update capabilities, availability of CVE cross references for signatures, and ability to log and display offending packets. A somewhat surprising result is that the open-source Snort IDS was rated third, an outcome that was better than 7 of the 9 commercial products tested.
1999 年以降、Network Computing 誌は、Neohapsis Laboratories による商用侵入検知製品の評価を後援してきました [18-20]。直近のレビュー [20] には、13 の商用 IDS と、オープンソースの Snort IDS [21] が含まれていました。これらのレビューは、非常に現実的なトラフィック負荷のもとでの性能を評価しており、年を追うごとに複雑さを増しています。定性的な結果は、管理フレームワークの使いやすさ、安定性、費用対効果、シグネチャの品質と深さ、カスタマイズのしやすさといった、実用上の特性に重点を置いています。定量的な結果には、検知された攻撃の数 [18-20] と、場合によっては、IDS がパケットを破棄し始めたり、シグネチャのチェックを実行できなくなったり、断片化されたパケットを再構成できなくなったりするまでに処理できる最大トラフィック速度が含まれます [19]。表 1 は、直近の評価 [20] の特性を示しています。現実的なバックグラウンドトラフィックは、シカゴの DePaul University のトラフィックを、隔離されたテストベッドネットワークにミラーリングして作られました。このトラフィックは、約 10,000 のホストを持つバックボーンネットワークのもので、トラフィック速度は 30〜88 M ビット/秒、パケットレートは毎秒 5,000〜7,000 パケットでした。評価では、試験された IDS のうち、これらの高いトラフィック負荷で動作できたのは 7 つだけで、1 つは数分後にクラッシュしたことが示されました。誤警報率については、慎重な分析は行われませんでした。8 つのネットワーク型 IDS に対して、直近の攻撃 9 件が仕掛けられました。9 件すべてを検知したものが 1 つ、2 件しか検知しなかったものが 2 つ、残りの 6 つは 5〜8 件を検知しました。各 IDS は、管理フレームワーク、シグネチャの品質と深さ、エンジンの安定性、費用対効果、カスタマイズの各分野で採点されました。バックエンドのデータベース API の有無、断片化されたパケットや TCP ストリームの再構成能力、シグネチャの自動更新機能、シグネチャに対する CVE 相互参照の有無、問題のあるパケットの記録と表示の能力といった特徴を含む、各 IDS の詳細な表も示されました。やや意外な結果は、オープンソースの Snort IDS が 3 位と評価され、試験された 9 つの商用製品のうち 7 つより良い結果となったことです。
4.7 The NSS Group
4.7 The NSS Group
The NSS Group evaluated IDSs and vulnerability scanners in 2000 and 2001. The report of the 2001 IDS evaluation [22] includes 15 commercial IDS products and the open-source Snort IDS [21]. The bulk of this report presents detailed information for each IDS on its architecture, ease of installation and configuration, and the types of reporting and analysis provided. Twelve IDSs were compared using either 18 or 66 commonly available exploits including port scans, DoS, Distributed DoS, Trojans, Web, FTP, SMTP, POP3, ICMP, and Finger attacks. Attacks were counted as detected only when they were reported “in as straightforward and clear a manner as possible.” Attack detection rates were measured on a 100 M bits/s network with no traffic and with small (64 byte), real-world, and large (1514 byte) packets that consumed 0%, 25%, 50%, 75%, and 100% of the network bandwidth. In addition, IDS attack detection for fewer attacks (7 to 8) was measured using packet manipulation IDS evasion techniques described in [3] and HTTP syntax manipulation provided by a tool designed to hide web attacks called “whisker.” Vulnerability to two tools named “stick” and “snot” designed to generate packets that elicit false alarms on IDSs was also determined. Attack detection rates are difficult to compare to other studies because correct detection required correct labeling and not simply detection. Detection rates with no traffic were high and above 80% for all but two IDSs. Detection rates fell off dramatically for some systems under high traffic loads, but remained high for others. Most systems were not vulnerable to the IDS evasion techniques tested and did not respond to tools designed to produce false alarms.
The NSS Group は、2000 年と 2001 年に IDS と脆弱性スキャナーを評価しました。2001 年の IDS 評価の報告書 [22] には、15 の商用 IDS 製品と、オープンソースの Snort IDS [21] が含まれています。この報告書の大部分は、各 IDS のアーキテクチャ、導入と設定のしやすさ、提供される報告と分析の種類に関する詳細な情報を示しています。12 の IDS が、ポートスキャン、DoS、Distributed DoS、トロイの木馬、Web、FTP、SMTP、POP3、ICMP、Finger の攻撃を含む、一般に入手可能な 18 または 66 のエクスプロイトを用いて比較されました。攻撃は、「できるだけ簡潔で明確な形で」報告された場合にのみ、検知されたものとして数えられました。攻撃の検知率は、100 M ビット/秒のネットワークで、トラフィックがない場合と、小さいパケット(64 バイト)、実環境のパケット、大きいパケット(1514 バイト)を用いてネットワーク帯域の 0%、25%、50%、75%、100% を消費させた場合について測定されました。加えて、より少ない攻撃(7〜8 件)に対する IDS の攻撃検知は、[3] に記載されたパケット操作による IDS 回避技法と、Web 攻撃を隠すために設計された「whisker」というツールによる HTTP 構文の操作を用いて測定されました。IDS に誤警報を引き起こすパケットを生成するよう設計された「stick」と「snot」という 2 つのツールに対する脆弱性も判定されました。正しい検知には、検知するだけでなく、攻撃を正しく識別して報告することが必要だったため、攻撃の検知率を他の研究と比較することは困難です。トラフィックがない場合の検知率は高く、2 つの IDS を除くすべてで 80% を超えていました。高いトラフィック負荷のもとでは、検知率が大きく低下したシステムもあれば、高いままのシステムもありました。ほとんどのシステムは、試験された IDS 回避技法の影響を受けず、誤警報を生じさせるよう設計されたツールにも反応しませんでした。
4.8 Network World Fusion
4.8 Network World Fusion
A more limited review of five commercial IDSs was reported by Network World Fusion magazine [23]. This review discussed ease of setup and use as well as features, but it also evaluated detection accuracy using 27 common attacks launched against three victim machines. These included stealthy web attacks generated using the “whisker” attack tool. Systems were tested using no background traffic and with artificially-generated loads of 40 M bits/sec (9,700 packets/sec), 60 M bits/sec (14,200 packets/sec), and 90 M bits/sec (67,000 packets/sec) on a 100 M bit/sec testbed network. Under no load, from roughly 78% to 93% of the 27 attacks were detected. Under the highest load of 90 M bits/sec, performance degraded substantially. Detection accuracy fell to 15% for one system and ranged from 63% to 78% for the other four.
Network World Fusion 誌 [23] は、5 つの商用 IDS についてのより限定的なレビューを報告しました。このレビューでは、機能とともに、設定と使用のしやすさが論じられましたが、3 台の被害マシンに対して仕掛けられた 27 件の一般的な攻撃を用いて、検知精度も評価されました。これには、“whisker” 攻撃ツールを使って生成されたステルス Web 攻撃が含まれていました。システムは、100 M ビット/秒のテストベッドネットワークで、バックグラウンドトラフィックがない場合と、40 M ビット/秒(9,700 パケット/秒)、60 M ビット/秒(14,200 パケット/秒)、90 M ビット/秒(67,000 パケット/秒)の人工的に生成された負荷の場合について試験されました。負荷がない場合は、27 件の攻撃のうち約 78% から 93% が検知されました。最も高い 90 M ビット/秒の負荷のもとでは、性能が大幅に低下しました。検知精度は、1 つのシステムで 15% に低下し、他の 4 つのシステムでは 63% から 78% の範囲でした。
| MITRE 1997 | UC Davis 1997 | MIT /LL 1998 | MIT /LL 1999 | AFRL 1998 | Neo- hapsis 2001 | NSS 2001 | Network World 2001 | |
|---|---|---|---|---|---|---|---|---|
| Attacks | ||||||||
| Number of Attacks | >10 | 4 | 38 | 56 | 19 | 9 | 66 | 27 |
| Number of victims | 6 | 1 | 4 | 5 | 4 | 3 | 3 | 3 |
| New/Novel Attacks | ✓ | ✓ | ||||||
| Stealthy Attacks | ✓ | ✓ | ✓ | ✓ | ✓ | ✓ | ✓ | |
| DoS Attacks | ✓ | ✓ | ✓ | ✓ | ✓ | ✓ | ||
| Metrics | ||||||||
| Probability of False Alarms | ✓ | ✓ | ✓ | |||||
| Probability of Detection | ✓ | ✓ | ✓ | ✓ | ✓ | ✓ | ||
| Receiver Operating Curve | ✓ | ✓ | ✓ | |||||
| Perf. Under High Traffic | ✓ | ✓ | ✓ | |||||
| Background traffic | ||||||||
| Real | ✓ | |||||||
| Generate on Testbed | ✓ | ✓ | ✓ | ✓ | ✓ | ✓ | ✓ | |
| ID Systems | ||||||||
| Number | 7 | 1 | 10 | 19 | 4 | 14 | 16 | 5 |
| Commercial | ✓ | ✓ | ✓ | ✓ | ||||
| Signature | ✓ | ✓ | ✓ | ✓ | ✓ | ✓ | ✓ | ✓ |
| Anomaly | ✓ | ✓ | ||||||
| Network | ✓ | ✓ | ✓ | ✓ | ✓ | ✓ | ✓ | ✓ |
| Host | ✓ | ✓ | ✓ | ✓ | ✓ | |||
| MITRE 1997 | UC Davis 1997 | MIT /LL 1998 | MIT /LL 1999 | AFRL 1998 | Neo- hapsis 2001 | NSS 2001 | Network World 2001 | |
|---|---|---|---|---|---|---|---|---|
| 攻撃 | ||||||||
| 攻撃の数 | >10 | 4 | 38 | 56 | 19 | 9 | 66 | 27 |
| 被害対象の数 | 6 | 1 | 4 | 5 | 4 | 3 | 3 | 3 |
| 新規/新奇な攻撃 | ✓ | ✓ | ||||||
| ステルス攻撃 | ✓ | ✓ | ✓ | ✓ | ✓ | ✓ | ✓ | |
| DoS 攻撃 | ✓ | ✓ | ✓ | ✓ | ✓ | ✓ | ||
| 指標 | ||||||||
| 誤警報の確率 | ✓ | ✓ | ✓ | |||||
| 検知の確率 | ✓ | ✓ | ✓ | ✓ | ✓ | ✓ | ||
| 受信者動作特性曲線 | ✓ | ✓ | ✓ | |||||
| 高トラフィック下の性能 | ✓ | ✓ | ✓ | |||||
| バックグラウンドトラフィック | ||||||||
| 実トラフィック | ✓ | |||||||
| テストベッドで生成 | ✓ | ✓ | ✓ | ✓ | ✓ | ✓ | ✓ | |
| 侵入検知システム | ||||||||
| 数 | 7 | 1 | 10 | 19 | 4 | 14 | 16 | 5 |
| 商用 | ✓ | ✓ | ✓ | ✓ | ||||
| シグネチャ | ✓ | ✓ | ✓ | ✓ | ✓ | ✓ | ✓ | ✓ |
| 異常検知 | ✓ | ✓ | ||||||
| ネットワーク | ✓ | ✓ | ✓ | ✓ | ✓ | ✓ | ✓ | ✓ |
| ホスト | ✓ | ✓ | ✓ | ✓ | ✓ | |||
Table 1: Characteristics of IDS tests
表 1: IDS 試験の特徴
5.0 Challenges of IDS Testing
5.0 IDS 試験の課題
There are several aspects of IDSs that make IDS testing challenging.
IDS の試験を困難にする側面がいくつかあります。
5.1 Difficulties in Collecting Attack Scripts and Victim Software
5.1 攻撃スクリプトと被害ソフトウェアの収集における困難
One problem that has inhibited progress in this field is the difficulty of collecting attack scripts and victim software. It is difficult and expensive to collect a large number of attack scripts. While such scripts are widely available on the Internet, it takes time to find relevant scripts to a particular testing environment. Once a script is identified, our experience is that it takes roughly one person-week to review the code, test the exploit, determine where the attack leaves evidence, automate the attack, and integrate it into a testing environment. As shown in Table 1, the number of attack types used in evaluations performed in 2001 ranges from 9 [20] to 66 [22], and many evaluations are heavily weighted towards scan and reconnaissance attacks due to the availability of these tools. A related problem is that it is difficult (but seemingly necessary) to collect appropriate victim software associated with each attack script. Often the various scripts only work against very specific version numbers of software that is difficult to obtain. The software itself may be difficult to obtain due to the expense or possibly the obscurity of the software. In addition, older vulnerable versions of the software may not be easily obtainable from the vendor. Vulnerable software is necessary for these evaluations and attack packets (or host audit logs) can’t simply be fed into an IDS. Without information about the features used to detect attacks, the only way to determine whether an attack is detected is to successfully run the attack.
この分野の進展を妨げてきた問題の 1 つは、攻撃スクリプトと被害ソフトウェアを収集することの難しさです。多数の攻撃スクリプトを集めるのは困難で費用がかかります。そのようなスクリプトはインターネット上で広く入手できますが、特定の試験環境に適したスクリプトを見つけるには時間がかかります。スクリプトを特定した後、コードをレビューし、エクスプロイトを試験し、攻撃がどこに証拠を残すかを判定し、攻撃を自動化して試験環境に統合するのに、私たちの経験では約 1 人週かかります。表 1 に示すように、2001 年に実施された評価で使用された攻撃の種類の数は 9 [20] から 66 [22] までの範囲にあり、多くの評価は、これらのツールが入手しやすいためにスキャンと偵察の攻撃に大きく偏っています。関連する問題として、各攻撃スクリプトに対応する適切な被害ソフトウェアを集めることが(必要と思われるにもかかわらず)困難です。多くの場合、各スクリプトは、入手が困難なソフトウェアの非常に特定のバージョンでしか動作しません。ソフトウェアそのものも、費用がかかるか、あるいはあまり知られていないために入手が困難な場合があります。加えて、ソフトウェアの古い脆弱なバージョンは、ベンダーから容易に入手できないことがあります。これらの評価には脆弱性のあるソフトウェアが必要であり、攻撃パケット(またはホストの監査ログ)を単純に IDS に入力することはできません。攻撃の検知に使われる特徴に関する情報がなければ、攻撃が検知されるかどうかを判定する唯一の方法は、攻撃を実際に実行することです。
5.2 Differing Requirements for Testing Signature Based vs. Anomaly Based IDSs
5.2 シグネチャベースと異常検知ベースの IDS の試験における要件の違い
Although most commercial IDSs are signature based, many research systems are anomaly-based, and it would be ideal if an IDS testing methodology would work for both of them. This is especially important since we would like to compare the performance of upcoming research systems to existing commercial ones. However, creating a single test to cover both types of systems presents some problems. First anomaly-based systems require normal traffic for training that does not include attacks. The MIT/LL 1999 evaluation [9,10], provided this type of training data specifically to train anomaly detection systems, but it was not available for other evaluations. Anomaly based-systems also may learn artifacts of the testing methodology and thereby perform well without actually detecting any real attacks. This may happen when all the attacks in a test are launched from a particular user, IP address, subnet, or MAC address. However, anomaly systems may learn subtle characteristics that are hard to predetermine such as packet window size, ports, typing speed, command set used, TCP flags, or connection durations which enable them to perform artificially well in the test environment. Conversely, testing signature based IDSs also presents some problems. Each signature based IDS detects a particular set of attacks. This means that the performance of a signature-based IDS in a test will, to a large degree, reflect the set of attacks used in the test. This presents a problem since researchers must decide which attacks to include, and this decision may arbitrarily favor one of the tested systems. To a lesser extent, anomaly systems can also have this problem since they will only process certain data streams when looking for attacks and they can't detect attacks in the unexamined data streams.
商用 IDS の大半はシグネチャベースですが、研究システムの多くは異常検知ベースであり、IDS の試験方法論が両方に対して機能するのが理想的です。今後の研究システムの性能を既存の商用システムと比較したいため、これは特に重要です。しかし、両方の種類のシステムを対象とする単一の試験を作ることには、いくつかの問題があります。第一に、異常検知ベースのシステムには、攻撃を含まない通常のトラフィックを訓練に使う必要があります。MIT/LL の 1999 年の評価 [9,10] では、異常検知システムの訓練専用にこの種の訓練データが提供されましたが、他の評価では利用できませんでした。異常検知ベースのシステムは、試験方法論のアーティファクトを学習し、その結果、実際の攻撃を検知せずに良い成績を出す場合もあります。これは、試験中のすべての攻撃が特定のユーザー、IP アドレス、サブネット、または MAC アドレスから仕掛けられた場合に起こり得ます。しかし、異常検知システムは、パケットのウィンドウサイズ、ポート、タイピング速度、使用するコマンドセット、TCP フラグ、接続時間など、事前に予測することが難しい微妙な特徴を学習し、試験環境で人為的に良い成績を出す場合があります。逆に、シグネチャベース IDS の試験にも問題があります。各シグネチャベース IDS が検知する攻撃は特定の集合に限られます。つまり、試験におけるシグネチャベース IDS の性能は、大きく試験で使われた攻撃の集合を反映します。研究者はどの攻撃を含めるかを決めなければならず、その決定が試験対象のシステムの 1 つを恣意的に有利にする可能性があるため、これは問題です。程度は小さいものの、異常検知システムにも同じ問題が生じることがあります。攻撃を探すときに処理するのは特定のデータストリームだけであり、調べていないデータストリームに含まれる攻撃は検知できないためです。
5.3 Differing Requirements for Testing Network Based vs. Host Based IDSs
5.3 ネットワーク型とホスト型の IDS の試験における要件の違い
Testing host based IDSs presents some difficulties not present when testing network based IDSs. In particular, network based IDSs can be tested in an off-line manner by creating a log file containing TCP traffic and then replaying that traffic to IDSs, as reported in [8-13]. This is convenient as all of the IDSs do not have to be tested at the same time, and the repeatability of the test is easy to achieve. Alternately, host based IDSs use a variety of system inputs in order to determine whether or not a system is under attack. This set of inputs changes between IDSs. Also, host based IDSs are designed to monitor a host as opposed to a single data feed (like network based IDSs). This makes it difficult to replay activity from log files in order to test a host based IDS. Since it is difficult to test a host based IDS in an off-line manner, researchers must explore more difficult real-time testing. Real-time testing presents problems of repeatability and consistency between runs.
ホスト型 IDS の試験には、ネットワーク型 IDS の試験にはない困難があります。特に、ネットワーク型 IDS は、[8-13] で報告されているように、TCP トラフィックを含むログファイルを作成し、そのトラフィックを IDS に再生することで、オフラインで試験できます。これは、すべての IDS を同時に試験する必要がなく、試験の再現性も容易に達成できるため、便利です。一方、ホスト型 IDS は、システムが攻撃を受けているかどうかを判定するために、さまざまなシステム入力を使います。この入力の集合は IDS によって異なります。また、ホスト型 IDS は、(ネットワーク型 IDS のような)単一のデータフィードではなく、ホストを監視するよう設計されています。このため、ホスト型 IDS を試験するためにログファイルから活動を再生することは困難です。ホスト型 IDS をオフラインで試験することは困難なので、研究者は、より難しいリアルタイムの試験を検討しなければなりません。リアルタイムの試験には、実行間の再現性と一貫性の問題があります。
5.4 Four Approaches to Using Background Traffic in IDS Tests
5.4 IDS 試験でバックグラウンドトラフィックを使う 4 つの手法
Most IDS testing approaches can be classified in one of four categories with regard to their use of background traffic: testing using no background traffic/logs, testing using real traffic/logs, testing using sanitized traffic/logs, and testing using simulated traffic/logs. While there may be other valid approaches, most researchers find it necessary to choose among these categories when designing their experiments. Furthermore, it is not yet clear which approach is the most effective for testing IDSs since each has unique advantages and disadvantages.
IDS 試験の手法の大半は、バックグラウンドトラフィックの使い方に関して、次の 4 つのカテゴリのいずれかに分類できます。バックグラウンドトラフィックやログを使わない試験、実トラフィックやログを使う試験、サニタイズしたトラフィックやログを使う試験、模擬のトラフィックやログを使う試験です。他にも妥当な手法はあるかもしれませんが、ほとんどの研究者は、実験を設計する際にこれらのカテゴリから選ぶ必要があると考えています。さらに、それぞれに固有の長所と短所があるため、IDS の試験にどの手法が最も有効かは、まだ明らかではありません。
Testing using no background traffic/logs
バックグラウンドトラフィックやログを使わない試験
Many evaluations [19,22,23] test IDSs using no background traffic as a reference condition. In such experiments, an IDS is set up on a host or network on which there is no activity. Then, computer attacks are launched on this host or network to determine whether or not the IDS can detect the attacks. This technique can determine an IDS hit rate but can say nothing about false positives. This approach is useful for verifying that an IDS has signatures for a set of attacks and that the IDS can properly label each attack. Furthermore, testing schemes using this approach are often much less costly to implement than the ones that include, sanitize, or create background traffic or logs.
多くの評価 [19,22,23] は、基準となる条件として、バックグラウンドトラフィックを使わずに IDS を試験します。このような実験では、IDS を、活動のないホストまたはネットワークに設置します。その後、そのホストまたはネットワークに対してコンピュータ攻撃を仕掛け、IDS が攻撃を検知できるかどうかを判定します。この手法では、IDS のヒット率は判定できますが、誤検知(偽陽性)については何も言えません。この手法は、IDS が一連の攻撃に対するシグネチャを持っていること、および IDS が各攻撃に適切なラベルを付けられることを検証するのに有用です。さらに、この手法を用いる試験方式は、バックグラウンドトラフィックやログを含めたり、サニタイズしたり、作成したりする方式より、実装費用がはるかに少なくて済むことがよくあります。
However, one drawback is that tests using this scheme are based on the implicit assumption that an IDSs ability to detect an attack is same regardless of background activity. At low levels of background activity it is not known whether or not this assumption is true (although we believe that it is). At high levels of background activity we know that IDSs performance often degrades (e.g. see [19, 22, 23] and thus the assumption may no longer be true.
しかし、欠点の 1 つは、この方式を用いる試験が、IDS の攻撃検知能力はバックグラウンド活動の有無にかかわらず同じであるという暗黙の前提に基づいていることです。バックグラウンド活動が少ない場合、この前提が正しいかどうかはわかっていません(私たちは正しいと考えていますが)。バックグラウンド活動が多い場合、IDS の性能はしばしば低下することがわかっており(例: [19, 22, 23] を参照)、そのため、この前提はもはや成り立たない可能性があります。
Testing using real traffic/logs
実トラフィックやログを使う試験
Some researchers have tested IDSs by injecting attacks into a stream of real background activity [20]. This is a very effective approach for determining the hit rate of an IDS given a particular level of background activity. Hit rate tests using this technique may be well received because the background activity is real and it contains all of the anomalies and subtleties of background activity. Furthermore, this technique enables the comparison of IDS hit rates at differing levels of activity.
実際のバックグラウンド活動のストリームに攻撃を注入して IDS を試験した研究者もいます [20]。これは、特定の水準のバックグラウンド活動のもとでの IDS のヒット率を判定するのに非常に有効な手法です。この手法を用いるヒット率の試験は、バックグラウンド活動が実際のものであり、バックグラウンド活動のあらゆる異常や微妙な点を含んでいるため、好意的に受け入れられるかもしれません。さらに、この手法により、異なる活動水準での IDS のヒット率を比較できます。
However, there are some drawbacks to using this technique:
しかし、この手法の使用にはいくつかの欠点があります。
1.It is usually not possible to have a repeatable test using real traffic since it is difficult politically and technically to store and replay large amounts of real traffic (especially in a backbone environment). Current hardware has trouble replaying network packets at speeds of over 100 Mb/sec and attempts to parallelize this process results in packet sequencing problems.
1.実トラフィックを使って再現可能な試験を行うことは、通常は不可能です。大量の実トラフィックを(特にバックボーン環境で)保存して再生することは、政治的にも技術的にも困難だからです。現在のハードウェアでは、100 Mb/秒を超える速度でのネットワークパケットの再生が困難であり、この処理を並列化しようとすると、パケットの順序付けの問題が生じます。
2.These experiments usually use a small set of victim machines that are set up for the sole purpose of being attacked during the test. Some IDSs may be able to detect that only these machines are attacked and thus artificially elevate their performance in the test. This is not a problem with most commercial systems but it does exist with many anomaly based research systems.
2.これらの実験では通常、試験中に攻撃を受けることだけを目的として設置された少数の被害マシンを使います。IDS の中には、攻撃されるのがこれらのマシンだけであることを検知でき、それによって試験での性能を人為的に高めるものがあるかもしれません。これは大半の商用システムでは問題になりませんが、多くの異常検知ベースの研究システムには存在します。
3.The real background activity used may contain anomalies unique to the network, which somehow favor one IDS over another. This could happen if a test network heavily used a particular protocol that was processed more deeply by a particular IDS. The IDS, which processes one protocol primarily, may then miss other attacks that it should detect.
3.使用される実際のバックグラウンド活動には、そのネットワークに固有の異常が含まれる場合があり、それが何らかの形で一方の IDS を他方より有利にします。これは、試験ネットワークが、特定の IDS でより深く処理される特定のプロトコルを多用している場合に起こり得ます。主に 1 つのプロトコルを処理する IDS は、検知すべき他の攻撃を見逃すかもしれません。
4.It is difficult to use this technique to determine false positive rates (and ROC curves). It is virtually impossible to guarantee the identification of all of the attacks that naturally occurred in the background activity, and this limitation hinders false positive rate testing. However, we hope that in practice it will become possible to use real traffic to determine false positive rates by manual analysis of the traffic logs, in addition to using statistical sampling techniques (to reduce the manual workload). Even with manual analysis, it will be impossible to guarantee that all attacks have been found, and some assumptions/approximations will have to be made.
4.この手法を用いて偽陽性率(と ROC 曲線)を判定することは困難です。バックグラウンド活動の中で自然に発生したすべての攻撃を特定できると保証することは事実上不可能で、この制約が偽陽性率の試験を妨げます。ただし、実際には、統計的なサンプリング技法(手作業の負担を減らすため)に加えて、トラフィックログの手作業による分析によって、実トラフィックを使って偽陽性率を判定できるようになることを私たちは期待しています。手作業による分析を行っても、すべての攻撃が見つかったと保証することは不可能で、いくつかの仮定や近似を置かなければなりません。
5.It is difficult to publicly distribute the test since there are privacy concerns related to the use of real background activity.
5.実際のバックグラウンド活動の使用に関するプライバシー上の懸念があるため、この試験を公に配布することは困難です。
6.Replay may damage the timings unless the replay honors the timestamps and the tecdump records (for TCP/IP NIDS) the timestamps to a granularity that is sufficiently fine.
6.再生がタイムスタンプを尊重し、かつ(TCP/IP NIDS では)tcpdump が十分に細かい粒度でタイムスタンプを記録している場合を除き、再生によってタイミングが損なわれる場合があります。
Testing using sanitized traffic/logs
サニタイズしたトラフィックやログを使う試験
To overcome the political and privacy problems of using, analyzing, and/or distributing real background activity; some researchers have proposed using sanitized background activity. Examples of sanitized traffic are cleansed TCP packet headers used in studies [24]. These headers were recorded during normal traffic for use in modeling network statistics and not to evaluate intrusion detection systems. In this approach, real background activity is prerecorded and then sanitized to remove any sensitive data. Then, attack data is injected within the sanitized data stream. This can be accomplished either by replaying the sanitized data and running attacks concurrently or by separately creating attack data and then inserting this data into the sanitized data. The advantage of this approach is that the test data can be freely distributed and the test is repeatable.
実際のバックグラウンド活動の使用、分析、配布(またはそのいずれか)に伴う政治的な問題とプライバシーの問題を克服するため、サニタイズしたバックグラウンド活動の使用を提案している研究者もいます。サニタイズされたトラフィックの例は、研究 [24] で使われている、浄化された TCP パケットヘッダーです。これらのヘッダーは、侵入検知システムを評価するためではなく、ネットワーク統計のモデル化に使うために、通常のトラフィック中に記録されました。この手法では、実際のバックグラウンド活動をあらかじめ記録し、機微なデータを取り除くためにサニタイズします。その後、サニタイズされたデータストリームの中に攻撃データを注入します。これは、サニタイズされたデータを再生しながら同時に攻撃を実行するか、攻撃データを別に作成してからそのデータをサニタイズされたデータに挿入することで実現できます。この手法の利点は、試験データを自由に配布でき、試験が再現可能なことです。
However, some difficulties exist when using this approach:
しかし、この手法を使う場合にはいくつかの困難があります。
1.Sanitization attempts may end up removing much of the content of the background activity thus creating a very unrealistic environment.
1.サニタイズの試みによって、バックグラウンド活動の内容の多くが取り除かれてしまい、非常に非現実的な環境になる場合があります。
2.Sanitization attempts may fail causing an accidental release of sensitive data. This scenario is very possible since it is infeasible for a human to verify the sanitization of a large volume of data. We feel that this risk is one that most organizations will not tolerate for the sake of a research project.
2.サニタイズの試みが失敗し、機微なデータを誤って公開してしまう場合があります。大量のデータのサニタイズを人間が検証することは不可能であるため、このシナリオは十分にあり得ます。ほとんどの組織は、研究プロジェクトのために、このリスクを許容しないだろうと私たちは考えています。
3.Since attacks have to be injected somewhat artificially into the sanitized data stream (regardless of the method used), the attacks will not realistically interact with the background activity. For example, buffer overflow attacks may be launched against a web server and cause the server to crash, but normal background requests to the web server may continue. This lack of interaction between the attacks and the background activity could be a problem when testing IDSs.
3.攻撃は、(用いる方法にかかわらず)サニタイズされたデータストリームの中に、ある程度人為的に注入しなければならないため、攻撃がバックグラウンド活動と現実的に相互作用することはありません。たとえば、バッファオーバーフロー攻撃が Web サーバーに対して仕掛けられてサーバーがクラッシュしても、Web サーバーへの通常のバックグラウンドの要求は続く場合があります。攻撃とバックグラウンド活動の間のこのような相互作用の欠如は、IDS を試験する際に問題となる場合があります。
4.When sanitizing real traffic, it may be difficult to remove attacks that existed in the data stream. If one is merely testing hit rates, then having unidentified attacks in the data is an inconvenience but not a major problem. However, having unidentified attacks in the background activity would pose a problem for any false positive testing. Further, sanitizing data may remove information needed to detect attacks.
4.実トラフィックをサニタイズする際には、データストリームに存在した攻撃を取り除くことが困難な場合があります。ヒット率を試験するだけであれば、データに識別されていない攻撃があることは不便ですが、大きな問題ではありません。しかし、バックグラウンド活動に識別されていない攻撃があると、偽陽性の試験にとっては問題になります。さらに、データのサニタイズによって、攻撃の検知に必要な情報が取り除かれる場合があります。
Testing by generating traffic on a testbed network
テストベッドネットワークでトラフィックを生成する試験
The most common approach to testing IDSs is to create a testbed network with hosts and network infrastructure that can be successfully attacked and to generate background traffic on this network [5, 7, 8-10, 12, 16, 19, 22, 23]. The testbed network includes victims of interest with background traffic generated by complex traffic generators that model the actual network traffic statistics [8-10]. Simpler commercial traffic generators can also be used to create a small number of packet types at a high rate [19, 22, 23]. Network traffic and host audit logs can be recorded in such a testbed for later playback [8-10,12] or evaluations can be performed in real time [16, 22, 23]. An advantage of this approach is that the data can be distributed freely since it does not contain any private or sensitive information. Another advantage is that we can guarantee that the background activity does not contain any unknown attacks since we created the background activity using the simulator. Lastly, IDS tests using simulated traffic are usually repeatable since one can either replay previously generated background activity or have the simulator regenerate the same background activity that was used in a previous test. This kind of test would appear to be one of the best since you can test both hit rates and false positive rates and use them to create ROC curves.
IDS を試験する最も一般的な手法は、攻撃が成功し得るホストとネットワーク基盤を備えたテストベッドネットワークを作り、このネットワーク上でバックグラウンドトラフィックを生成することです [5, 7, 8-10, 12, 16, 19, 22, 23]。テストベッドネットワークには、実際のネットワークトラフィックの統計をモデル化した複雑なトラフィックジェネレーターが生成するバックグラウンドトラフィックとともに、対象とする被害ホストが含まれます [8-10]。より単純な商用のトラフィックジェネレーターを使って、少数の種類のパケットを高い速度で生成することもできます [19, 22, 23]。このようなテストベッドでは、ネットワークトラフィックとホストの監査ログを記録して後で再生することも [8-10,12]、評価をリアルタイムに行うことも [16, 22, 23] できます。この手法の利点は、プライベートな情報や機微な情報を含まないため、データを自由に配布できることです。もう 1 つの利点は、シミュレーターを使ってバックグラウンド活動を作成したため、バックグラウンド活動に未知の攻撃が含まれていないことを保証できることです。最後に、模擬トラフィックを使う IDS の試験は、以前に生成したバックグラウンド活動を再生するか、以前の試験で使ったのと同じバックグラウンド活動をシミュレーターに再生成させることができるため、通常は再現可能です。この種の試験は、ヒット率と偽陽性率の両方を試験でき、それらを使って ROC 曲線を作成できるため、最良の試験の 1 つのように思われます。
However, there are several difficulties to this approach:
しかし、この手法にはいくつかの困難があります。
1.It is very costly and difficult to create a simulation.
1.シミュレーションを作成するには、非常に費用がかかり、困難です。
2.It may be difficult to simulate a high bandwidth environment due to resource constraints.
2.リソースの制約のために、高帯域幅の環境を模擬することが困難な場合があります。
3.The need for different types of traffic to model various networks; for example, USAF traffic differs from traffic on academic networks.
3.さまざまなネットワークをモデル化するために、異なる種類のトラフィックが必要になります。たとえば、米空軍のトラフィックは、学術ネットワークのトラフィックとは異なります。
6.0 IDS Testing Research Recommendations
6.0 IDS 試験の研究に関する推奨事項
This section presents a variety of research recommendations in the area of IDS testing. We first present recommendations for improving data sets and then present recommendations for enhancing metrics.
この節では、IDS 試験の分野におけるさまざまな研究上の推奨事項を示します。まず、データセットを改善するための推奨事項を示し、次に、指標を強化するための推奨事項を示します。
6.1 Shared Datasets
6.1 共有データセット
There is a great need for IDS testing datasets that can be shared openly between multiple organizations. There are very few such datasets that have even semi-realistic data or have the attacks within the background traffic labeled. Existing datasets [12, 29] have been used frequently by researchers. Without such shareable datasets IDS researchers must either expend enormous resources creating proprietary datasets or use fairly simplistic data for their testing.
複数の組織の間でオープンに共有できる IDS 試験用のデータセットが強く必要とされています。半ば現実的なデータを含むものや、バックグラウンドトラフィック内の攻撃にラベルが付けられているものでさえ、そのようなデータセットはごくわずかです。既存のデータセット [12, 29] は、研究者によって頻繁に使われてきました。共有できるデータセットがなければ、IDS の研究者は、独自のデータセットを作成するために膨大なリソースを費やすか、試験にかなり単純なデータを使うしかありません。
6.2 Attack Traces
6.2 攻撃のトレース
In section 5 we pointed out that it was difficult and expensive to collect a large set of attacks scripts for the purposes of IDS testing. A possible alternative is to use attack "traces" instead of real attacks. Attack traces are the log files that are produced when an attack is launched and that specify exactly what happened during the attack. Such traces usually consist of files containing network packets or systems logs that correspond to an instance of an attack. We need a better understanding of the advantages and disadvantages of replaying such traces as a part of an IDS test. In addition, there is a great need to provide the security community with a large set of attack traces. Such information could be easily added to and would greatly augment existing vulnerability databases such as [25] or [26]. The resulting vulnerability/attack trace databases would aid IDS testing researchers and would also provide valuable data for IDS developers.
第 5 節で、IDS の試験のために大量の攻撃スクリプトを集めることが困難で費用がかかることを指摘しました。可能な代替策は、実際の攻撃の代わりに攻撃の "トレース" を使うことです。攻撃のトレースは、攻撃が仕掛けられたときに生成され、攻撃中に何が起きたかを正確に示すログファイルです。このようなトレースは通常、攻撃の 1 つの事例に対応するネットワークパケットまたはシステムログを含むファイルで構成されます。IDS の試験の一部としてこのようなトレースを再生することの利点と欠点について、より深い理解が必要です。加えて、セキュリティコミュニティに大量の攻撃トレースを提供することが強く必要とされています。そのような情報は、[25] や [26] などの既存の脆弱性データベースに容易に追加でき、それらを大幅に充実させるでしょう。その結果得られる脆弱性・攻撃トレースのデータベースは、IDS 試験の研究者の助けとなり、IDS 開発者にとっても貴重なデータとなるでしょう。
6.3 Cleansing Real Data
6.3 実データのクレンジング
Real data generally cannot be distributed due to privacy and sensitivity issues. Research into methods to remove the confidential data within background traffic while preserving the essential features of the traffic could enable the use of such data within IDS tests. Such an advance would alleviate the need for researchers to spend additional effort creating expensive simulated environments.
実データは、プライバシーと機微性の問題のため、一般には配布できません。トラフィックの本質的な特徴を保ったまま、バックグラウンドトラフィック内の機密データを取り除く方法の研究は、そのようなデータを IDS の試験で使えるようにするかもしれません。そのような進歩があれば、研究者が高価な模擬環境の作成にさらなる労力を費やす必要が減るでしょう。
Another problem with real background data is that it may contain attacks about which we know nothing. It is possible, however, that such attacks could be automatically removed. One idea is to collect a trace of events in the real world and use a simulation system to produce data similar to those in the collected trace. The simulator would use its traffic generation routines to approximate the real world trace. After the creation and storage of the simulated activity, the original collected traces could be discarded. Thus, we have a system that can model real world environments with the model only restricted by the complexity of the simulator. Since the test data is created by the simulation system with only a model of the system being simulated, traffic in the trace that does not conform to the specified model (and that the simulator can thus not reproduce), such as attacks, would be filtered out by default. In addition, there should no longer be any concern about privacy issues since the traces that drive the simulator would contain only traffic summaries and not proprietary traffic content.
実際のバックグラウンドデータのもう 1 つの問題は、私たちが何も知らない攻撃を含んでいる可能性があることです。しかし、そのような攻撃を自動的に取り除ける可能性はあります。1 つの案は、実世界のイベントのトレースを収集し、シミュレーションシステムを使って、収集したトレースに似たデータを生成することです。シミュレーターは、そのトラフィック生成ルーチンを使って、実世界のトレースを近似します。模擬された活動を作成して保存した後は、収集した元のトレースを破棄できます。こうして、モデルがシミュレーターの複雑さによってのみ制限される、実世界の環境をモデル化できるシステムが得られます。試験データは、模擬対象のシステムのモデルだけを使ってシミュレーションシステムが作成するため、トレース中の、指定されたモデルに適合しない(したがってシミュレーターが再現できない)トラフィック、たとえば攻撃は、既定で除外されます。加えて、シミュレーターを動かすトレースには、独自のトラフィック内容ではなくトラフィックの要約だけが含まれるため、プライバシーの問題についての懸念はもはやなくなるはずです。
6.4 Sensor and Detector Alert Datasets
6.4 センサーおよび検知器の警報データセット
Some intrusion correlation systems do not use a raw data stream (like network or audit data) as input, but instead rely upon alerts and aggregated information reports from IDSs and other sensors [27, 28]. We need to develop systems that can generate realistic alert log files for testing correlation systems. A solution is to deploy real sensors and to “sanitize” the resulting alert stream by replacing IP addresses. Sanitization in general is difficult for network activity traces but it is relatively easy in this special case since alert streams use well defined formats and generally contain little sensitive data (the exception being IP addresses and possibly passwords). Alternately, some statistical techniques for generating synthetic alert datasets from scratch are presented by [14].
侵入相関付けシステムの中には、(ネットワークデータや監査データのような)生のデータストリームを入力として使わず、IDS やその他のセンサーからの警報と集約された情報報告に依存するものがあります [27, 28]。相関付けシステムを試験するために、現実的な警報ログファイルを生成できるシステムを開発する必要があります。解決策は、実際のセンサーを配備し、IP アドレスを置き換えることで、得られた警報ストリームを「サニタイズ」することです。サニタイズは、ネットワーク活動のトレースでは一般に困難ですが、この特殊な場合には比較的容易です。警報ストリームは明確に定義された形式を使い、一般に機微なデータをほとんど含まないためです(例外は IP アドレスと、場合によってはパスワードです)。あるいは、合成の警報データセットをゼロから生成するいくつかの統計的な技法が、[14] に示されています。
6.5 Real-Life Performance Metrics
6.5 実環境の性能指標
ROC curves are created by stepping through alerts emitted by the detector in order of confidence or severity. The goal is to show how many alerts must be analyzed to achieve a certain level of performance and, by applying costs, to determine an optimal point of operation. The confidence or severity-based ROC curve however is not a good indicator of how the intrusion detection system will perform with an intelligent human administrator sitting at the console. The human administrator does not consider the IDS alerts alone, but can make use of additional information such as network maps, user trouble reports, and learned knowledge of common false alarms when considering which alerts to analyze first. Thus the “alert ordering” used as a basis of the ROC is often not realistic. A further problem is that few current detection systems output a continuous range of scores but instead output only a few priorities (low/medium/high). Thus the ROC consists of only a few very coarse points.
ROC 曲線は、検知器が出力する警報を、信頼度または重大度の順にたどって作成されます。その目的は、ある水準の性能を達成するために分析しなければならない警報の数を示し、コストを適用して最適な動作点を判定することです。ただし、信頼度または重大度に基づく ROC 曲線は、知的な人間の管理者がコンソールに座っている場合に侵入検知システムがどのような性能を示すかを示す良い指標ではありません。人間の管理者は IDS の警報だけを考慮するのではなく、どの警報を先に分析するかを検討する際に、ネットワーク図、利用者の障害報告、一般的な誤警報について学んだ知識などの追加情報を利用できます。したがって、ROC の基礎として使われる「警報の順序付け」は、現実的でないことが多くあります。さらに、現在の検知システムの多くは、連続した範囲のスコアを出力せず、少数の優先度(低/中/高)だけを出力するという問題もあります。このため、ROC はごく少数の非常に粗い点だけで構成されることになります。
It might be useful to use alert type, source and/or destination IP address along with severity or confidence to order a set of IDS alerts for the purpose of estimating cost and performance of a detector. Alerts could be ordered in “bins” either in the order that an administrator will examine them or the reverse (the order in which they will be "tuned" out and ignored). Then the ROC-like curve could be plotted by considering alerts in that order and plotting a point for each bin. One example would be to place alerts in bins by alert type and Internet-side IP address and to order them by the number of alerts in each bin. Often an administrator will dismiss very frequently occurring alerts as false alarms by analyzing only a few alerts of a particular type or source and then ignoring (or writing a rule to drop) all subsequent similar alerts. The ROC-like plot could be created to show the number or percentage of attacks that would be tuned out or missed as a result of ignoring each subsequent alert type, source, or combination. The curve could provide a much more realistic basis for comparing attack detection and false alarm performance and for estimating the cost of using the intrusion detection product at various levels of performance.
検知器のコストと性能を推定する目的で、IDS の警報の集合を順序付けるために、重大度または信頼度とともに、警報の種類、発信元または宛先の IP アドレス(またはその両方)を使うことが有用かもしれません。警報は、管理者が調べる順序、またはその逆("チューニング" で除外して無視される順序)で、「ビン」に並べることができます。その後、その順序で警報を考慮し、ビンごとに点をプロットすることで、ROC に似た曲線をプロットできます。1 つの例は、警報の種類とインターネット側の IP アドレスによって警報をビンに入れ、各ビンの警報の数で順序付けることです。管理者は、特定の種類や発信元の警報を少数だけ分析した後、以降の同様の警報をすべて無視する(または破棄するルールを書く)ことで、非常に頻繁に発生する警報を誤警報として退けることがよくあります。ROC に似たプロットは、以降の各警報の種類、発信元、またはその組合せを無視した結果としてチューニングで除外される、または見逃される攻撃の数または割合を示すように作成できます。この曲線は、攻撃検知と誤警報の性能を比較し、さまざまな水準の性能で侵入検知製品を使用するコストを推定するための、はるかに現実的な根拠を提供できるでしょう。
6.6 New Technologies
6.6 新しい技術
Newly evolving technologies in IDS include: “meta-IDS” technologies [30] that attempt to ease the burden of cross-vendor data management; “IDS appliances “ [31] that promise increased processing power and more robust remote management capabilities; and “Application-layer” technologies [32] that filter potential attack traffic to downstream scanner on dedicated network segments. These “new directions” focus on new technologies for enterprises or service providers [33] and represent examples of research efforts to solve the difficulties of false positives, traffic bottlenecks and distinguishing serious attacks from nuisance alarms.
IDS で新たに発展している技術には、ベンダー間のデータ管理の負担を軽減しようとする「メタ IDS」技術 [30]、処理能力の向上とより堅牢な遠隔管理機能を約束する「IDS アプライアンス」[31]、専用のネットワークセグメント上の下流のスキャナーに潜在的な攻撃トラフィックをフィルターする「アプリケーション層」技術 [32] があります。これらの「新しい方向性」は、エンタープライズやサービスプロバイダー向けの新しい技術に重点を置いており [33]、偽陽性、トラフィックのボトルネック、そして深刻な攻撃と迷惑な警報の区別という困難を解決するための研究の取り組みの例です。
7.0 Conclusion
7.0 結論
In this paper, we have described some of the previous efforts to measure IDS accuracy, and we have outlined some of the difficulties that have been encountered. We believe that a periodic, comprehensive evaluation of IDSs could be valuable for acquisition managers, security analysts and R&D program managers. However, because both normal and attack traffic are so variable from site to site, and because normal and attack traffic evolve over time, these evaluations will likely be complex and expensive to conduct. To enable evaluations to be made more efficiently, we recommend that the community find ways to create, label, share and update relevant data sets containing normal and attack activity.
本稿では、IDS の精度を測定するこれまでの取り組みのいくつかを説明し、そこで直面した困難のいくつかを概説しました。IDS の定期的で包括的な評価は、調達管理者、セキュリティアナリスト、研究開発プログラムの管理者にとって価値があると私たちは考えています。しかし、通常のトラフィックも攻撃トラフィックもサイトごとに非常に多様であり、また通常のトラフィックも攻撃トラフィックも時とともに変化するため、これらの評価の実施は複雑で費用がかかるでしょう。評価をより効率的に行えるようにするため、コミュニティが、通常の活動と攻撃の活動を含む関連するデータセットを作成し、ラベル付けし、共有し、更新する方法を見つけることを推奨します。
8.0 References
8.0 参考文献
[1] Howell D., “hackers often choose their corporate targets”, Investors Business Daily, January 30, 2002
[1] Howell D., “hackers often choose their corporate targets”, Investors Business Daily, January 30, 2002
[2]. Mann D. E. and Christey S. M., Towards a Common Enumeration of Vulnerabilities, 2nd Workshop on Research with Security Vulnerability Databases, Purdue University, West Lafayette, Indiana, January 21-22, 1999, http://www.cve.mitre.org/docs/cerias.html.
[2]. Mann D. E. and Christey S. M., Towards a Common Enumeration of Vulnerabilities, 2nd Workshop on Research with Security Vulnerability Databases, Purdue University, West Lafayette, Indiana, January 21-22, 1999, http://www.cve.mitre.org/docs/cerias.html.
[3] Ptacek T.H. and Newsham T.N., Insertion, Evasion, and Denial of Service: Eluding Network Intrusion Detection, 1998, Secure Networks Inc., http://secinf.net/info/ids/idspaper/idspaper.html.
[3] Ptacek T.H. and Newsham T.N., Insertion, Evasion, and Denial of Service: Eluding Network Intrusion Detection, 1998, Secure Networks Inc., http://secinf.net/info/ids/idspaper/idspaper.html.
[4] http://www.networkmagazine.com/article/NMG20000517S0075
[4] http://www.networkmagazine.com/article/NMG20000517S0075
[5] Puketza N., Chung M., Olsson R. O., and Mukherjee B., A Software Platform for Testing Intrusion Detection Systems. IEEE Software, 1997. 14,(5), 43-51, http://seclab.cs.ucdavis.edu/papers/pdfs/np-mc-97.pdf.
[5] Puketza N., Chung M., Olsson R. O., and Mukherjee B., A Software Platform for Testing Intrusion Detection Systems. IEEE Software, 1997. 14,(5), 43-51, http://seclab.cs.ucdavis.edu/papers/pdfs/np-mc-97.pdf.
[6] Heberlein T.L., Dias G. V., Levitt K. N., Mukherjee B., Wood J., and Wolber D., A Network Security Monitor, in Proceedings 1990 IEEE Symposium on Research in Security and Privacy. 1990, IEEE Computer Society Press: Los Alamitos, CA. p. 296-304, http://seclab.cs.ucdavis.edu/papers/pdfs/th-gd-90.pdf.
[6] Heberlein T.L., Dias G. V., Levitt K. N., Mukherjee B., Wood J., and Wolber D., A Network Security Monitor, in Proceedings 1990 IEEE Symposium on Research in Security and Privacy. 1990, IEEE Computer Society Press: Los Alamitos, CA. p. 296-304, http://seclab.cs.ucdavis.edu/papers/pdfs/th-gd-90.pdf.
[7] Debar H., Dacier M., Wespi A., and Lampart S., A workbench for intrusion detection systems, March 1998, IBM Zurich Research Laboratory, Ruschlikon, Switzerland.
[7] Debar H., Dacier M., Wespi A., and Lampart S., A workbench for intrusion detection systems, March 1998, IBM Zurich Research Laboratory, Ruschlikon, Switzerland.
[8]Lippmann R.P., Fried D.J., Graf I., Haines J.W., Kendall K.R., McClung D., Weber D., Webster S.E., Wyschogrod D., Cunningham R.K., and Zissman M.A., Evaluating Intrusion Detection Systems: The 1998 DARPA Off-Line Intrusion Detection Evaluation, in Proceedings of the 2000 DARPA Information Survivability Conference and Exposition (DISCEX), Vol. 2, 12-26, 2000, IEEE Computer Society Press: Los Alamitos, CA, http://www.ll.mit.edu/IST/pubs/discex2000-rpl-paper.pdf.
[8]Lippmann R.P., Fried D.J., Graf I., Haines J.W., Kendall K.R., McClung D., Weber D., Webster S.E., Wyschogrod D., Cunningham R.K., and Zissman M.A., Evaluating Intrusion Detection Systems: The 1998 DARPA Off-Line Intrusion Detection Evaluation, in Proceedings of the 2000 DARPA Information Survivability Conference and Exposition (DISCEX), Vol. 2, 12-26, 2000, IEEE Computer Society Press: Los Alamitos, CA, http://www.ll.mit.edu/IST/pubs/discex2000-rpl-paper.pdf.
[9]Lippmann, R.P., Haines J.W., Fried D.J., Korba J., and Das K., The 1999 DARPA OffLine Intrusion Detection Evaluation. Computer Networks, 2000. 34(2), 579-595, http://www.ll.mit.edu/IST/ideval/pubs/2000/1999Eval-ComputerNetworks2000.pdf.
[9]Lippmann, R.P., Haines J.W., Fried D.J., Korba J., and Das K., The 1999 DARPA OffLine Intrusion Detection Evaluation. Computer Networks, 2000. 34(2), 579-595, http://www.ll.mit.edu/IST/ideval/pubs/2000/1999Eval-ComputerNetworks2000.pdf.
[10]Lippmann R.P. and Haines J., Analysis and Results of the 1999 DARPA Off-Line Intrusion Detection Evaluation, in Recent Advances in Intrusion Detection, Third International Workshop, RAID 2000 Toulouse, France, October 204, 2000 Proceedings, H. Debar, L. Me, and S.F. Wu, Editors. 2000, Springer Verlag, 162-182, http://link.springer.de/link/service/series/0558/bibs/1907/19070162.htm.
[10]Lippmann R.P. and Haines J., Analysis and Results of the 1999 DARPA Off-Line Intrusion Detection Evaluation, in Recent Advances in Intrusion Detection, Third International Workshop, RAID 2000 Toulouse, France, October 204, 2000 Proceedings, H. Debar, L. Me, and S.F. Wu, Editors. 2000, Springer Verlag, 162-182, http://link.springer.de/link/service/series/0558/bibs/1907/19070162.htm.
[11] Elkan C., Results of the KDD'99 Classifier Learning Contest, September 1999, Sponsored by the International Conference on Knowledge Discovery in Databases, http://www-cse.ucsd.edu/users/elkan/clresults.html.
[11] Elkan C., Results of the KDD'99 Classifier Learning Contest, September 1999, Sponsored by the International Conference on Knowledge Discovery in Databases, http://www-cse.ucsd.edu/users/elkan/clresults.html.
[12] MIT Lincoln Laboratory, DARPA Intrusion Detection Evaluation Data Sets, Jan. 2002, http://www.ll.mit.edu/IST/ideval/data/data_index.html
[12] MIT Lincoln Laboratory, DARPA Intrusion Detection Evaluation Data Sets, Jan. 2002, http://www.ll.mit.edu/IST/ideval/data/data_index.html
[13] Song D., Shaffer G., and Undy M., Nidsbench - A network intrusion detection test suite. 1999Recent Advances in Intrusion Detection, Second International Workshop, RAID 1999, West Lafayette, Indianahttp://citeseer.nj.nec.com/cache/papers/cs/19418/http:zSzzSzwww.monkey.orgzSz~dugsongzSztalkszSznidsbench-slides.pdf/song99nidsbench.pdf.
[13] Song D., Shaffer G., and Undy M., Nidsbench - A network intrusion detection test suite. 1999Recent Advances in Intrusion Detection, Second International Workshop, RAID 1999, West Lafayette, Indianahttp://citeseer.nj.nec.com/cache/papers/cs/19418/http:zSzzSzwww.monkey.orgzSz~dugsongzSztalkszSznidsbench-slides.pdf/song99nidsbench.pdf.
[14] Haines J.A., Rossey L.M., Lippmann R.P., and Cunningham R. K.. Extending the DARPA Off-Line Intrusion Detection Evaluations in Darpa Information Survivability Conference and Exposition (DISCEX) II. 2001. Anaheim, CA: IEEE Computer Society.
[14] Haines J.A., Rossey L.M., Lippmann R.P., and Cunningham R. K.. Extending the DARPA Off-Line Intrusion Detection Evaluations in Darpa Information Survivability Conference and Exposition (DISCEX) II. 2001. Anaheim, CA: IEEE Computer Society.
[15] McHugh J., Testing intrusion detection systems: A critique of the 1998 and 1999 DARPA intrusion detection system evaluations as performed by Lincoln Laboratory. ACM Transactions on Informationand System Security, 2000. 3,(4), 262-294, http://www1.acm.org/pubs/citations/journals/tissec/2000-3-4/p262-mchugh/.
[15] McHugh J., Testing intrusion detection systems: A critique of the 1998 and 1999 DARPA intrusion detection system evaluations as performed by Lincoln Laboratory. ACM Transactions on Informationand System Security, 2000. 3,(4), 262-294, http://www1.acm.org/pubs/citations/journals/tissec/2000-3-4/p262-mchugh/.
[16] Durst R., Champion T., Witten B., Miller E., and Spagnuolo L., Testing and Evaluating Computer Intrusion Detection Systems. Communications of the ACM, 1999. 42,(7), 53-61, http://www1.acm.org/pubs/articles/journals/cacm/1999-42-7/p53-durst/p53-durst.pdf.
[16] Durst R., Champion T., Witten B., Miller E., and Spagnuolo L., Testing and Evaluating Computer Intrusion Detection Systems. Communications of the ACM, 1999. 42,(7), 53-61, http://www1.acm.org/pubs/articles/journals/cacm/1999-42-7/p53-durst/p53-durst.pdf.
[17] Aguirre S.J. and Hill W.H., Intrusion Detection Fly-Off: Implications for the United States Navy, September 1997, MITRE Technical Report MTR 97W096, McLean, Virginia.
[17] Aguirre S.J. and Hill W.H., Intrusion Detection Fly-Off: Implications for the United States Navy, September 1997, MITRE Technical Report MTR 97W096, McLean, Virginia.
[18] Shipley G., ISS RealSecure Pushes Past Newer IDS Players. Network Computing, 17 May 1999, http://www.networkcomputing.com/1010/1010r1.html.
[18] Shipley G., ISS RealSecure Pushes Past Newer IDS Players. Network Computing, 17 May 1999, http://www.networkcomputing.com/1010/1010r1.html.
[19] Shipley G., Intrusion Detection, Take Two. Network Computing, 15 November 1999, http://www.nwc.com/1023/1023f1.html.
[19] Shipley G., Intrusion Detection, Take Two. Network Computing, 15 November 1999, http://www.nwc.com/1023/1023f1.html.
[20] Mueller P. and Shipley G., Dragon claws its way to the top. Network Computing, 20 August 2001, 45-67, http://www.networkcomputing.com/1217/1217f2.html.
[20] Mueller P. and Shipley G., Dragon claws its way to the top. Network Computing, 20 August 2001, 45-67, http://www.networkcomputing.com/1217/1217f2.html.
[21] Roesch M., Snort - Lightweight Intrusion Detection for Networks, in USENIX 13th Systems Administration Conference - LISA '99. 1999: Seattle, Washington, http://www.usenix.org/publications/library/proceedings/lisa99/roesch.html.
[21] Roesch M., Snort - Lightweight Intrusion Detection for Networks, in USENIX 13th Systems Administration Conference - LISA '99. 1999: Seattle, Washington, http://www.usenix.org/publications/library/proceedings/lisa99/roesch.html.
[22] The NSS Group, Intrusion Detection Systems Group Test (Edition 2). December 2001, Oakwood House, Wennington, Cambridgeshire, Englandhttp://www.nss.co.uk/ids/.
[22] The NSS Group, Intrusion Detection Systems Group Test (Edition 2). December 2001, Oakwood House, Wennington, Cambridgeshire, Englandhttp://www.nss.co.uk/ids/.
[23] Yocom B. and Brown K., Intrusion battleground evolves, Network World Fusion, October 8 2001, 53-62, http://www.nwfusion.com/reviews/2001/1008bg.html.
[23] Yocom B. and Brown K., Intrusion battleground evolves, Network World Fusion, October 8 2001, 53-62, http://www.nwfusion.com/reviews/2001/1008bg.html.
[24] National Laboratory for Applied Network Research, NLAR network traffic packet header traces, 2002, http://pma.nlanr.net/Traces/.
[24] National Laboratory for Applied Network Research, NLAR network traffic packet header traces, 2002, http://pma.nlanr.net/Traces/.
[25] Mell, P. and Grance T., ICAT Metabase CVE Vulnerability Search Engine, 2002, National Institute of Standards and Technology, http://icat.nist.gov/.http://icat.nist.gov.
[25] Mell, P. and Grance T., ICAT Metabase CVE Vulnerability Search Engine, 2002, National Institute of Standards and Technology, http://icat.nist.gov/.http://icat.nist.gov.
[26] Security Focus Bugtraq Vulnerability Database, http://securityfocus.com.
[26] Security Focus Bugtraq Vulnerability Database, http://securityfocus.com.
[27] Vigna G., Kemmerer R.A., Blix P. “Designing a Web of Highly-Configurable Intrusion Detection Sensors”, Recent Advances in Intrusion Detection (RAID 2001), Davis, CA, October 2001.
[27] Vigna G., Kemmerer R.A., Blix P. “Designing a Web of Highly-Configurable Intrusion Detection Sensors”, Recent Advances in Intrusion Detection (RAID 2001), Davis, CA, October 2001.
[28] Valdes A., and Skinner K. “Probabilistic Alert Correlation”, Recent Advances in Intrusion Detection (RAID 2001), Davis, CA, October 2001.
[28] Valdes A., and Skinner K. “Probabilistic Alert Correlation”, Recent Advances in Intrusion Detection (RAID 2001), Davis, CA, October 2001.
[29] Forrest S., Ingham K., Inoue H,, Domayaji A., and Warrender C. “Sequence-based Intrusion Detection”, Computer Immune Systems Data Sets and Software. Computer Science, The University of New Mexico, http://www.cs.unm.edu/%7Eimmsec/data-sets.htm.
[29] Forrest S., Ingham K., Inoue H,, Domayaji A., and Warrender C. “Sequence-based Intrusion Detection”, Computer Immune Systems Data Sets and Software. Computer Science, The University of New Mexico, http://www.cs.unm.edu/%7Eimmsec/data-sets.htm.
[30]Loshin P., “Meta Detection”, Information Security, page 52 TruSecure corporation, August 2001.
[30]Loshin P., “Meta Detection”, Information Security, page 52 TruSecure corporation, August 2001.
[31]Briney A., “The Age Of Appliances”, Information Security, page 56 TruSecure corporation, August 2001.
[31]Briney A., “The Age Of Appliances”, Information Security, page 56 TruSecure corporation, August 2001.
[32]Kessler G. C., “IDS-In-Depth”, Information Security, page 58 TruSecure corporation, August 2001.
[32]Kessler G. C., “IDS-In-Depth”, Information Security, page 58 TruSecure corporation, August 2001.
[33]Briney A., “New Directions in Intrusion Detection”, Information Security, page 49 TruSecure corporation, August 2001. www.infosecuritymag.com
[33]Briney A., “New Directions in Intrusion Detection”, Information Security, page 49 TruSecure corporation, August 2001. www.infosecuritymag.com
[34] Hall M., and Wiley K., “Capacity Verification for High Speed Network Intrusion Detection Systems”, Fifth International Symposium on Recent Advances in Intrusion Detection (RAID 2002), Zurich, Switzerland, October 16-18, 2002.
[34] Hall M., and Wiley K., “Capacity Verification for High Speed Network Intrusion Detection Systems”, Fifth International Symposium on Recent Advances in Intrusion Detection (RAID 2002), Zurich, Switzerland, October 16-18, 2002.