NIST SP 800-142 日本語訳
英語タイトル : Practical Combinatorial Testing日本語タイトル : 実用的な組合せテスト
公開日 : 2010-10-07
原文URL : https://csrc.nist.gov/pubs/sp/800/142/final
翻訳編集 : 自動生成(有志による非公式の日本語訳), 原文取得日 : 2026-09-30, 訳文 : 589 / 646 ブロック
[要約] SP 800-142 は、実用的なソフトウェアのテストに向けて、組合せテストを紹介し、システムおよびソフトウェアの保証に効果的に利用する方法を説明する文書です。構成テスト、入力パラメータのテスト、シーケンス被覆配列、組合せカバレッジの測定、ランダムテストとの比較、テストオラクル、障害箇所の特定などを章立てで扱います。ソフトウェア実装上の誤りは情報システムの脆弱性の大きな要因であり、組合せ手法は多くのアプリケーションでテストの費用を減らし有効性を高めるとして、その活用を促します。
NIST Special Publication 800-142
NIST特別刊行物800-142
[NIST のロゴ。公的な標章のため、この非公式サイトには掲載していません。原本 PDF を参照してください。]
INFORMATION SECURITY
情報セキュリティ
PRACTICAL COMBINATORIAL TESTING
実践的な組合せテスト
D. Richard Kuhn, Raghu N. Kacker, Yu Lei
D. Richard Kuhn、Raghu N. Kacker、Yu Lei
October, 2010
2010年10月
[米国商務省の紋章。公的な標章のため、この非公式サイトには掲載していません。原本 PDF を参照してください。]
U.S. Department of Commerce Gary Locke, Secretary
米国商務省 長官 Gary Locke
National Institute of Standards and Technology Patrick Gallagher, Director
米国国立標準技術研究所 所長 Patrick Gallagher
Reports on Computer Systems Technology
コンピューターシステム技術に関する報告
The Information Technology Laboratory (ITL) at the National Institute of Standards and Technology (NIST) promotes the U.S. economy and public welfare by providing technical leadership for the Nation’s measurement and standards infrastructure. ITL develops tests, test methods, reference data, proof of concept implementations, and technical analyses to advance the development and productive use of information technology. ITL’s responsibilities include the development of technical, physical, administrative, and management standards and guidelines for the cost-effective security and privacy of sensitive unclassified information in Federal computer systems. This Special Publication 800-series reports on ITL’s research, guidance, and outreach efforts in computer security, and its collaborative activities with industry, government, and academic organizations.
米国国立標準技術研究所(NIST)の情報技術研究所(ITL)は、米国の計量・標準インフラに関する技術的リーダーシップを提供することで、米国経済および公共の福祉を促進しています。ITLは、情報技術の発展と生産的な利用を促進するため、試験、試験方法、参照データ、概念実証の実装、および技術分析を開発します。ITLの責務には、連邦政府のコンピューターシステムにおける機微な非機密情報を費用対効果よく保護するための、技術的、物理的、管理的および運営上の標準ならびに指針の策定が含まれます。この特別刊行物800シリーズは、コンピューターセキュリティに関するITLの研究、指針、普及活動、および産業界、政府、学術機関との協力活動を報告します。
U.S. GOVERNMENT PRINTING OFFICE WASHINGTON: 2010
米国政府印刷局 ワシントン:2010
For sale by the Superintendent of Documents, U.S. Government Printing Office Internet: bookstore.gpo.gov — Phone: (202) 512-1800 — Fax: (202) 512-2250 Mail: Stop SSOP, Washington, DC 20402-0001
販売元:Superintendent of Documents, U.S. Government Printing Office インターネット:bookstore.gpo.gov — 電話:(202) 512-1800 — ファクス:(202) 512-2250 郵送先:Stop SSOP, Washington, DC 20402-0001
Note to Readers
読者への注記
Note to Readers
読者への注記
This document is a publication of the National Institute of Standards and Technology (NIST) and is not subject to U.S. copyright. Certain commercial entities, equipment, or materials may be identified in this document in order to describe an experimental procedure or concept adequately. Such identification is not intended to imply recommendation or endorsement by the National Institute of Standards and Technology, nor is it intended to imply that the entities, materials, or equipment are necessarily the best available for the purpose.
本書は米国国立標準技術研究所(NIST)の刊行物であり、米国の著作権の対象ではありません。実験手順または概念を適切に説明するため、本書で特定の商業組織、装置または材料に言及することがあります。そのような特定は、NISTによる推奨または承認を意味するものではなく、また、該当する組織、材料または装置が目的に適した最良のものであることを意味するものでもありません。
For questions or comments on this document, contact Rick Kuhn, kuhn@nist.gov or 301-975-3337.
本文書に関する質問またはコメントは、Rick Kuhn(kuhn@nist.gov または 301-975-3337)に連絡すること。
Acknowledgements
謝辞
Special thanks are due to Tim Grance, Jim Higdon, Eduardo Miranda, and Tom Wissink for early support and evangelism of this work, and especially Jim Lawrence who has been an integral part of the team since the beginning. We have benefitted tremendously from interactions with researchers and practitioners including Renee Bryce, Myra Cohen, Charles Colbourn, Mike Ellims, Vincent Hu, Justin Hunter, Aditya Mathur, Josh Maximoff, Carmelo Montanez-Rivera, Jenise Reyes Rodriguez, Rick Rivello, Sreedevi Sampath, Mike Trela, and Tao Xie. We also gratefully acknowledge NIST SURF students Michael Forbes, William Goh, Evan Hartig, Menal Modha, Kimberley O’Brien-Applegate, Michael Reilly, Malcolm Taylor and Bryan Wilkinson who contributed to the software and methods described in this document.
本研究を初期段階で支援し、その普及に尽力したTim Grance、Jim Higdon、Eduardo Miranda、Tom Wissinkに深く感謝します。特に、当初からチームの中核を担ってきたJim Lawrenceに感謝します。Renee Bryce、Myra Cohen、Charles Colbourn、Mike Ellims、Vincent Hu、Justin Hunter、Aditya Mathur、Josh Maximoff、Carmelo Montanez-Rivera、Jenise Reyes Rodriguez、Rick Rivello、Sreedevi Sampath、Mike Trela、Tao Xieをはじめとする研究者や実務家との交流から、多大な恩恵を受けました。また、本書で述べるソフトウェアや手法に貢献したNIST SURFの学生、Michael Forbes、William Goh、Evan Hartig、Menal Modha、Kimberley O’Brien-Applegate、Michael Reilly、Malcolm Taylor、Bryan Wilkinsonにも深く感謝します。
Table of Contents
目次
Executive Summary
エグゼクティブサマリー
Software implementation errors are one of the most significant contributors to information system security vulnerabilities, making software testing an essential part of system assurance. In 2003 NIST published a widely cited report which estimated that inadequate software testing costs the US economy $59.5 billion per year, even though 50% to 80% of development budgets go toward testing. Exhaustive testing – testing all possible combinations of inputs and execution paths – is impossible for real-world software, so high assurance software is tested using methods that require extensive staff time and thus have enormous cost. For less critical software, budget constraints often limit the amount of testing that can be accomplished, increasing the risk of residual errors that lead to system failures and security weaknesses.
ソフトウェア実装上の誤りは、情報システムのセキュリティ脆弱性をもたらす最も大きな要因の一つであり、ソフトウェアテストはシステム保証に欠かせません。2003年、NISTは広く引用されている報告書を公表し、開発予算の50%から80%がテストに費やされているにもかかわらず、不十分なソフトウェアテストが米国経済に年間$59.5 billionの損失をもたらすと推計しました。入力および実行経路のあらゆる組合せをテストする網羅的テストは、実世界のソフトウェアでは不可能です。そのため、高い保証を必要とするソフトウェアでは、多大なスタッフ時間を要し、莫大な費用がかかる手法でテストが行われます。重要度がそれほど高くないソフトウェアでは、予算の制約によって実施できるテスト量が限られることが多く、残存する誤りがシステム障害やセキュリティ上の弱点につながるリスクが高まります。
Combinatorial testing is a method that can reduce cost and increase the effectiveness of software testing for many applications. The key insight underlying this form of testing is that not every parameter contributes to every failure and most failures are caused by interactions between relatively few parameters. Empirical data gathered by NIST and others suggest that software failures are triggered by only a few variables interacting (6 or fewer). This finding has important implications for testing because it suggests that testing combinations of parameters can provide highly effective fault detection. Pairwise (2-way combinations) testing is sometimes used to obtain reasonably good results at low cost, but pairwise testing may miss 10% to 40% or more of system bugs, and is thus not sufficient for mission-critical software. Combinatorial testing beyond 2-way has been limited, primarily due to a lack of good algorithms for higher interaction levels such as 4-way to 6-way testing. New algorithms, however, have made combinatorial testing beyond pairwise practical for industrial use.
組合せテストは、多くのアプリケーションにおいてソフトウェアテストのコストを削減し、その有効性を高める手法です。このテスト方法の基礎となる重要な洞察は、すべてのパラメーターがあらゆる障害に関与するわけではなく、ほとんどの障害は比較的少数のパラメーター間の相互作用によって引き起こされるという点です。NISTなどが収集した実証データは、ソフトウェア障害がわずかな数の変数(6個以下)の相互作用のみによって引き起こされることを示唆しています。この知見はテストに重要な意味を持ちます。すなわち、パラメーターの組合せをテストすることで、非常に効果的に故障を検出できる可能性があります。低コストでかなり良好な結果を得るために、ペアワイズテスト(2-wayの組合せ)が使われることがあります。しかし、ペアワイズテストではシステムのバグの10%から40%以上を見逃す可能性があり、ミッションクリティカルなソフトウェアには不十分です。2-wayを超える組合せテストは、主に4-wayから6-wayなど、より高い相互作用レベルのテストに適したアルゴリズムが不足していたため、限定的にしか利用されてこませんでした。しかし、新たなアルゴリズムにより、ペアワイズを超える組合せテストが産業用途で実用可能になりました。
This publication provides a self-contained tutorial on using combinatorial testing for real-world software. It introduces the key concepts and methods, explains use of software tools for generating combinatorial tests (freely available on the NIST web site csrc.nist.gov/acts), and discusses advanced topics such as the use of formal models of software to determine the expected results for each set of test inputs. With each topic, a section on costs and practical considerations explains tradeoffs and limitations that may impact resources or funding. The material is accessible to an undergraduate student of computer science or engineering, and includes an extensive set of references to papers that provide more depth on each topic.
本書は、実世界のソフトウェアに組合せテストを適用するための、単独で読めるチュートリアルを提供します。主要な概念と手法を紹介し、組合せテストを生成するソフトウェアツール(NISTのウェブサイト csrc.nist.gov/acts から無償で入手可能)の使い方を説明します。また、ソフトウェアの形式モデルを使って、各テスト入力セットに対して期待される結果を求める方法など、高度な話題も扱います。各話題には、資源や予算に影響する可能性のあるトレードオフと制約を説明する、コストおよび実務上の考慮事項の節を設けています。内容は、コンピューターサイエンスまたは工学を専攻する学部生にも理解できる水準であり、各話題をさらに詳しく扱う論文を幅広く参照しています。
1 INTRODUCTION
1 はじめに
Software implementation errors are one of the most significant contributors to information system security vulnerabilities, making software testing an essential part of system assurance. Combinatorial methods can help reduce the cost and increase the effectiveness of software testing for many applications. This publication provides a self-contained tutorial on using combinatorial testing for real-world software. It introduces the key concepts and methods, explains use of software tools for generating combinatorial tests (freely available on the NIST web site csrc.nist.gov/acts), and discusses advanced topics such as the use of formal models of software to determine the expected results for each possible set of test inputs. The material is accessible to an undergraduate student of computer science or engineering, and includes an extensive set of references to papers that provide more depth on each topic.
ソフトウェア実装上の誤りは、情報システムのセキュリティ脆弱性をもたらす最も大きな要因の一つであり、ソフトウェアテストはシステム保証に欠かせません。組合せ手法は、多くのアプリケーションにおいてソフトウェアテストのコストを削減し、その有効性を高めるのに役立ちます。本書は、実世界のソフトウェアに組合せテストを適用するための、単独で読めるチュートリアルを提供します。主要な概念と手法を紹介し、組合せテストを生成するソフトウェアツール(NISTのウェブサイト csrc.nist.gov/acts から無償で入手可能)の使い方を説明します。また、ソフトウェアの形式モデルを使って、考えられる各テスト入力セットに対する期待結果を求める方法など、高度な話題も扱います。内容は、コンピューターサイエンスまたは工学を専攻する学部生にも理解できる水準であり、各話題をさらに詳しく扱う論文を幅広く参照しています。
1.1 Authority
1.1 権限
The National Institute of Standards and Technology (NIST) developed this document in furtherance of its statutory responsibilities under the Federal Information Security Management Act (FISMA) of 2002, Public Law 107-347.
米国国立標準技術研究所(NIST)は、2002年連邦情報セキュリティ管理法(FISMA)、公法107-347に基づく法定責務を推進するため、本書を作成しました。
NIST is responsible for developing standards and guidelines, including minimum requirements, for providing adequate information security for all agency operations and assets, but such standards and guidelines shall not apply to national security systems. This guideline is consistent with the requirements of the Office of Management and Budget (OMB) Circular A-130, Section 8b(3), “Securing Agency Information Systems,” as analyzed in A-130, Appendix IV: Analysis of Key Sections. Supplemental information is provided in A-130, Appendix III.
NISTは、すべての機関の業務および資産に対して適切な情報セキュリティを提供するための最低要件を含む標準および指針を策定する責任を負います。ただし、このような標準および指針は国家安全保障システムには適用されません。本指針は、行政管理予算局(OMB)通達A-130第8b(3)節「機関情報システムの保護」の要件と整合しており、その分析はA-130付録IV「主要な節の分析」に示されています。補足情報はA-130付録IIIに記載されています。
This guideline has been prepared for use by Federal agencies. It may be used by nongovernmental organizations on a voluntary basis and is not subject to copyright, though attribution is desired.
本指針は連邦機関での使用を目的として作成されています。政府機関以外の組織も任意に使用してよく、著作権の対象ではありませんが、出典を明記することが望まれます。
Nothing in this document should be taken to contradict standards and guidelines made mandatory and binding on Federal agencies by the Secretary of Commerce under statutory authority, nor should these guidelines be interpreted as altering or superseding the existing authorities of the Secretary of Commerce, Director of the OMB, or any other Federal official.
本書のいかなる内容も、法定権限に基づき商務長官が連邦機関に義務付け、拘束力を持たせた標準および指針に反すると解釈すべきではありません。また、本指針は、商務長官、OMB長官、またはその他の連邦政府職員が有する既存の権限を変更したり、それに優先したりするものと解釈すべきではありません。
1.2 Document Scope and Purpose
1.2 文書の範囲および目的
This publication introduces combinatorial testing and explains how to use it effectively for system and software assurance.
本刊行物は、組合せテストを紹介し、システムおよびソフトウェアの保証に効果的に利用する方法を説明します。
1.3 Audience and Assumptions
1.3 対象読者および前提
This document assumes that the readers have experience with software development and testing, some familiarity with scripting languages, and basic knowledge of programming, logic, and discrete mathematics equivalent to what would be acquired in an undergraduate computer science or engineering program. Most of the material should be readily understood by an undergraduate student with some programming experience. Because of the constantly changing nature of the information technology industry, readers are strongly encouraged to take advantage of other resources (including those listed in this document) for more current and detailed information.
本書の読者は、ソフトウェア開発とテストの経験、スクリプト言語に関する一定の知識、およびコンピューターサイエンスまたは工学の学部課程で習得する程度のプログラミング、論理学、離散数学の基礎知識を有することを前提とします。内容の大部分は、プログラミング経験のある学部生であれば容易に理解できます。情報技術業界は常に変化しているため、読者には、本書に記載するものを含む他の情報源を活用して、より新しく詳細な情報を得ることを強く推奨します。
1.4 Organization: How to use this Document
1.4 文書の構成:本書の使い方
The document is divided into chapters, with background material covered in appendices. Because it is intended to be self-contained, each chapter provides material that will be used in later topics. Chapters 2, 3, and 4 will be needed by most testers, while the material in later chapters is specialized for various topics. Appendices include a review of basic combinatorics and a discussion of empirical data on software failures.
本書は章に分かれており、背景となる内容は付録で扱います。単独で読めることを意図しているため、各章では後続の話題で使用する内容を説明します。ほとんどのテスト担当者には第2章、第3章、第4章が必要となる一方、後の章は各種の専門的な話題を扱います。付録には、基本的な組合せ論の復習とソフトウェア障害に関する実証データの考察が含まれます。
Readers new to combinatorial testing may want to review the basics of combinatorics in Appendix A and read chapters 2, 3, and 4. Other sections of the publication can be reserved for later use as needed.
組合せテストに初めて取り組む読者は、付録Aで組合せ論の基礎を復習し、第2章、第3章、第4章を読むとよいです。本刊行物の他の節は、必要に応じて後から参照できます。
2 COMBINATORIAL METHODS IN TESTING
2 試験における組合せ手法
Developers of large data-intensive software often notice an interesting—though not surprising—phenomenon: When usage of an application jumps dramatically, components that have operated for months without trouble suddenly develop previously undetected errors. For example, the application may have been installed on a different OS-hardware-DBMS-networking platform, or newly added customers may have account records with an oddball combination of values that have not occurred before. Some of these rare combinations trigger failures that have escaped previous testing and extensive use. Such failures are known as interaction failures, because they are only exposed when two or more input values interact to cause the program to reach an incorrect result.
大規模でデータ集約型のソフトウェアの開発者は、興味深い(とはいえ意外ではない)現象に気づくことが多くあります。アプリケーションの利用が急増すると、何か月も問題なく動いていたコンポーネントで、これまで検出されなかった誤りが突然表面化します。例えば、アプリケーションが異なるOS、ハードウェア、DBMS、ネットワークの組合せで稼働するようになった場合や、新たに加わった顧客のアカウント記録に、それまで発生したことのない珍しい値の組合せが含まれている場合があります。このようなまれな組合せのいくつかは、これまでのテストや広範な利用をすり抜けてきた障害を引き起こします。これらの障害は相互作用障害と呼ばれます。2つ以上の入力値が相互に作用して、プログラムに誤った結果を生じさせたときにのみ明らかになるためです。
Combinatorial testing can help detect problems like this early in the testing life cycle. The key insight underlying t-way combinatorial testing is that not every parameter contributes to every failure and most failures are triggered by a single parameter value or interactions between a relatively small number of parameters (for more on the number of parameters interacting in failures, see Appendix B). To detect interaction failures, software developers often use “pairwise testing”, in which all possible pairs of parameter values are covered by at least one test. Its effectiveness is based on the observation that software failures often involve interactions between parameters. For example, a router may be observed to fail only for a particular protocol when packet volume exceeds a certain rate, a 2-way interaction between protocol type and packet rate. Figure 1 illustrates how such a 2-way interaction may happen in code. Note that the failure will only be triggered when both pressure < 10 and volume > 300 are true.
組合せテストは、このような問題をテストライフサイクルの早い段階で検出するのに役立ちます。t-way組合せテストの根底にある重要な洞察は、すべてのパラメータがすべての障害に関与するわけではなく、ほとんどの障害は単一のパラメータ値、または比較的少数のパラメータ間の相互作用によって引き起こされるということです(障害において相互作用するパラメータの数については付録Bを参照してください)。相互作用による障害を検出するために、ソフトウェア開発者はしばしば「ペアワイズテスト」を用います。これは、パラメータ値のあらゆる組のそれぞれを少なくとも1つのテストで網羅する手法です。その有効性は、ソフトウェアの障害がパラメータ間の相互作用を伴うことが多いという観察に基づいています。例えば、ルータが、パケット量がある速度を超えたときに特定のプロトコルでのみ障害を起こすことが観察される場合があります。これはプロトコル種別とパケット速度の間の2-way相互作用です。図1は、このような2-way相互作用がコード中でどのように生じうるかを示しています。この障害は、pressure < 10 と volume > 300 の両方が真である場合にのみ引き起こされることに注意されました。
if (pressure < 10) { // do something
if (pressure < 10) { // do something
if (volume > 300) {
if (volume > 300) {
faulty code! BOOM!
faulty code! BOOM!
} else {
} else {
good code, no problem
good code, no problem
}
} else {
} else {
// do something else
// それ以外の処理を行う
}
Figure 1. 2-way interaction failure triggered only when two conditions are true.
図1. 2つの条件が同時に真の場合にのみ発生する2要因相互作用障害。
Pairwise testing can be highly effective and good tools are available to generate arrays with all pairs of parameter value combinations. But until recently only a handful of tools could generate combinations beyond 2-way, and most that did could require impractically long times to generate 3-way, 4-way, or 5-way arrays because the generation process is mathematically complex. Pairwise testing, i.e. 2-way combinations, has come to be accepted as the common approach to combinatorial testing because it is computationally tractable and reasonably effective.
ペアワイズテストは非常に効果的になりうるものであり、パラメータ値のすべての組を含む配列を生成する優れたツールも入手できます。しかし最近まで、2-wayを超える組合せを生成できるツールはごくわずかしかなく、生成できるツールの大半も、生成過程が数学的に複雑であるため、3-way、4-way、5-wayの配列の生成に非実用的なほど長い時間を要することがありました。ペアワイズテスト、すなわち2-wayの組合せは、計算上扱いやすく、かつ相応に効果的であるため、組合せテストの一般的な手法として受け入れられるようになりました。
But what if some failure is triggered only by a very unusual combination of 3, 4, or more sensor values? It is very unlikely that pairwise tests would detect this unusual case; we would need to test 3-way and 4-way combinations of values. But is testing all 4-way combinations enough to detect all errors? What degree of interaction occurs in real failures in real systems? Surprisingly, this question had not been studied when NIST began investigating interaction failures in 1999. Results showed that across a variety of domains, all failures could be triggered by a maximum of 4-way to 6-way interactions [34, 35, 36, 65]. As shown in Figure 2, the detection rate increased rapidly with interaction strength (the interaction level t in t-way combinations is often referred to as strength). With the NASA application, for example, 67% of the failures were triggered by only a single parameter value, 93% by 2-way combinations, and 98% by 3-way combinations. The detection rate curves for the other applications studied are similar, reaching 100% detection with 4 to 6-way interactions. Studies by other researchers [6, 7, 26] have been consistent with these results.
しかし、ある障害が3つ、4つ、あるいはそれ以上のセンサ値の非常にまれな組合せによってのみ引き起こされるとしたらどうか。ペアワイズテストがこのようなまれな事例を検出する可能性は非常に低く、値の3-wayおよび4-wayの組合せをテストする必要があります。では、すべての4-wayの組合せをテストすれば、すべての誤りを検出するのに十分なのか。実際のシステムの実際の障害では、どの程度の相互作用が生じているのか。意外なことに、NISTが1999年に相互作用による障害の調査を始めた時点では、この問いは研究されていませんでした。調査の結果、さまざまな分野にわたって、すべての障害は最大でも4-wayから6-wayの相互作用によって引き起こされうることが示されました[34, 35, 36, 65]。図2に示すように、検出率は相互作用の強度とともに急速に上昇しました(t-way組合せにおける相互作用のレベルtは、しばしば強度と呼ばれます)。例えばNASAのアプリケーションでは、障害の67%は単一のパラメータ値のみによって、93%は2-wayの組合せによって、98%は3-wayの組合せによって引き起こされていました。調査した他のアプリケーションの検出率曲線も同様であり、4から6-wayの相互作用で検出率100%に達しています。他の研究者による研究[6, 7, 26]も、これらの結果と整合しています。
Failures appear to be caused by interactions of only a few variables, so tests that cover all such few-variable interactions can be very effective.
障害は少数の変数の相互作用のみによって引き起こされるとみられるため、そのような少数変数の相互作用をすべて網羅するテストは非常に効果的になりうます。
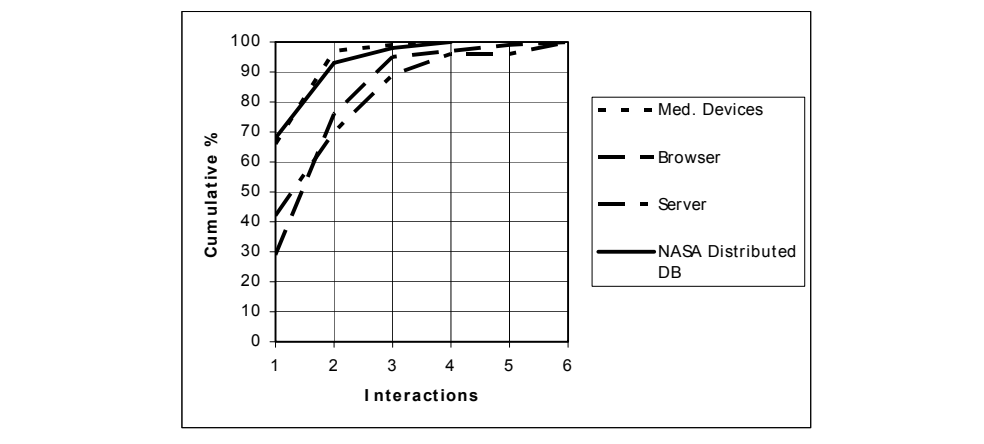
図2. 相互作用強度1から6に対する誤り検出率。枠で囲まれた折れ線グラフである。横軸「Interactions」(相互作用)は1から6まで、縦軸「Cumulative %」(累積%)は0から100まで10刻みである。4本の線があり、凡例は Med. Devices(医療機器。短い破線)、Browser(ブラウザ。長い破線)、Server(サーバー。長短の破線)、NASA Distributed DB(NASAの分散データベース。実線)である。相互作用1では約30%から約70%の間から始まり、いずれも相互作用2で約70%から約95%の間まで急に上がり、相互作用4から6までに100%に達する。数値は記されていない。
Figure 2. Error detection rates for interaction strengths 1 to 6
図2. 相互作用強度1から6に対する誤り検出率
While not conclusive, these results are interesting because they suggest that, while pairwise testing is not sufficient, the degree of interaction involved in failures is relatively low. We summarize this result in what we call the interaction rule, an empirically-derived rule that characterizes the distribution of interaction faults:
決定的ではないものの、これらの結果は興味深いものです。ペアワイズテストでは十分でない一方で、故障に関与する相互作用の次数は比較的低いことを示唆しているからです。我々はこの結果を、相互作用則と呼ぶ規則にまとめます。これは相互作用障害の分布を特徴付ける、経験的に導かれた規則である:
Interaction Rule: Most failures are induced by single factor faults or by the joint combinatorial effect (interaction) of two factors, with progressively fewer failures induced by interactions between three or more factors.
相互作用則:ほとんどの障害は、単一因子の欠陥、または2つの因子の組合せによる共同効果(相互作用)によって誘発され、3つ以上の因子間の相互作用によって誘発される障害は次第に少なくなります。
Testing all 4-way to 6-way combinations may therefore provide reasonably high assurance. As with most issues in software, however, the situation is not that simple. Efficient generation of test suites to cover all \(t\)-way combinations is a difficult mathematical problem that has been studied for nearly a century. In addition, most parameters are continuous variables which have possible values in a very large range (+/- \(2^{32}\) or more). These values must be discretized to a few distinct values. Most glaring of all is the problem of determining the correct result that should be expected from the system under test for each set of test inputs. Generating 1,000 test data inputs is of little help if we cannot determine what the system under test (SUT) should produce as output for each of the 1,000 tests.
したがって、4-wayから6-wayまでのすべての組合せを試験すれば、かなり高い保証が得られる可能性があります。しかし、ソフトウェアの問題の多くと同様に、事情はそれほど単純ではありません。すべての\(t\)-way組合せを網羅するテストスイートを効率よく生成することは、ほぼ1世紀にわたって研究されてきた難しい数学の問題です。加えて、ほとんどのパラメーターは連続変数であり、取り得る値の範囲は非常に広い(+/- \(2^{32}\)以上)。これらの値は、少数の異なる値に離散化しなければなりません。なかでも最も明白な問題は、各組のテスト入力に対して、試験対象システムから期待される正しい結果を決めることです。1,000件のテストそれぞれについて、試験対象システム(SUT)が何を出力すべきかを決められなければ、1,000件のテストデータ入力を生成してもほとんど役に立ちません。
With the exception of combination covering test generation, these challenges are common to all types of software testing, and a variety of good techniques have been developed for dealing with them. What has made combinatorial testing practical today is the development of efficient algorithms to generate tests covering t-way combinations, and effective methods of integrating the tests produced into the testing process. A variety of approaches introduced in this publication can be used to make combinatorial testing a practical and effective addition to the software tester’s toolbox.
網羅的な組合せのテスト生成を除けば、これらの課題はあらゆる種類のソフトウェアテストに共通しており、それらに対処するためのさまざまな優れた手法が開発されてきました。今日、組合せテストを実用的なものにしたのは、t-wayの組合せを網羅するテストを生成する効率的なアルゴリズムの開発と、生成されたテストをテストプロセスに組み込む効果的な方法の開発です。本書で紹介するさまざまな手法を用いれば、組合せテストを、ソフトウェアテスト担当者の道具箱に加わる実用的かつ効果的な手段とすることができます。
Advances in algorithms have made combinatorial testing beyond pairwise finally practical.
アルゴリズムの進歩により、ペアワイズを超える組合せテストがついに実用的になりました。
A note on terminology: we use the definitions below, following the Institute of Electrical and Electronics Engineers [30]. The term “bug” may also be used where its meaning is clear.
用語に関する注記:本書では、Institute of Electrical and Electronics Engineers [30] に従い、以下の定義を用います。意味が明確な場合には「バグ」という用語を用いることもあります。
•error: a mistake made by a developer. This could be a coding error or a misunderstanding of requirements or specification.
•エラー(error):開発者が犯す誤り。コーディングの誤りの場合もあれば、要件や仕様の誤解の場合もあります。
•fault: a difference between an incorrect program and one that correctly implements a specification. An error may result in one or more faults.
•欠陥(fault):誤ったプログラムと、仕様を正しく実装したプログラムとの差異。1つのエラーが1つ以上の欠陥をもたらすことがあります。
•failure: a result that differs from the correct result as specified. A fault in code may result in zero or more failures, depending on inputs and execution path.
•障害(failure):仕様で定められた正しい結果と異なる結果。コード中の1つの欠陥は、入力と実行経路に応じて、0個以上の障害をもたらすことがあります。
2.1 Two Forms of Combinatorial Testing
2.1 組合せテストの2つの形態
There are basically two approaches to combinatorial testing – use combinations of configuration parameter values, or combinations of input parameter values. In the first case, we select combinations of values of configurable parameters. For example, a server might be tested by setting up all 4-way combinations of configuration parameters such as number of simultaneous connections allowed, memory, OS, database size, etc., with the same test suite run against each configuration. The tests may have been constructed using any methodology, not necessarily combinatorial coverage. The combinatorial aspect of this approach is in achieving combinatorial coverage of configuration parameter values. (Note, the term variable is often used interchangeably with parameter to refer to inputs to a function.)
組合せテストには基本的に2つのアプローチがあります。構成パラメータ値の組合せを用いる方法と、入力パラメータ値の組合せを用いる方法です。前者では、構成可能なパラメータの値の組合せを選択します。例えば、サーバをテストする場合、許容される同時接続数、メモリ、OS、データベースのサイズなどの構成パラメータのすべての4-wayの組合せを設定し、各構成に対して同じテストスイートを実行することが考えられます。テスト自体はどのような方法論で構築されていてもよく、必ずしも組合せ網羅に基づく必要はありません。このアプローチにおける組合せの側面は、構成パラメータ値の組合せ網羅を達成する点にあります。(なお、関数への入力を指す場合、変数という用語はしばしばパラメータと同じ意味で用いられます。)
Combinatorial testing can be applied to configurations, input data, or both.
組合せテストは、構成、入力データ、またはその両方に適用できます。
In the second approach, we select combinations of input data values, which then become part of complete test cases, creating a test suite for the application. In this case combinatorial coverage of input data values is required for tests constructed. A typical ad hoc approach to testing involves subject matter experts setting up use scenarios, then selecting input values to exercise the application in each scenario, possibly supplementing these tests with unusual or suspected problem cases. In the combinatorial approach to input data selection, a test data generation tool is used to cover all combinations of input values up to some specified limit. One such tool is ACTS (described in Appendix C), which is available freely from NIST.
第2の方法では、入力データ値の組合せを選択し、それらを完全なテストケースに組み込んでアプリケーション用のテストスイートを作成します。この場合、構築するテストでは入力データ値の組合せ網羅が必要です。一般的なアドホック方式では、専門家が利用シナリオを設定し、各シナリオでアプリケーションを実行する入力値を選び、さらに異常値または問題が疑われるケースのテストを加える場合があります。入力データを選択する組合せ方式では、指定した上限までの入力値の組合せすべてを網羅するため、テストデータ生成ツールを使用します。ACTS(付録Cで説明)はそのようなツールの一つであり、NISTから無料で入手できます。
2.1.1 Configuration Testing
2.1.1 構成テスト
Many, if not most, software systems have a large number of configuration parameters. Many of the earliest applications of combinatorial testing were in testing all pairs of system configurations. For example, telecommunications software may be configured to work with different types of call (local, long distance, international), billing (caller, phone card, 800), access (ISDN, VOIP, PBX), and server for billing (Windows Server, Linux/MySQL, Oracle). The software must work correctly with all combinations of these, so a single test suite could be applied to all pairwise combinations of these four major configuration items. Any system with a variety of configuration options is a suitable candidate for this type of testing.
多くの、場合によってはほとんどの、ソフトウェアシステムには多数の構成パラメーターがあります。組合せテストの初期の適用例の多くは、システム構成のすべてのペアを試験するものだった。たとえば、通信ソフトウェアは、通話種別(市内、長距離、国際)、課金方式(発信者、テレホンカード、800番)、アクセス方式(ISDN、VOIP、PBX)、課金サーバー(Windows Server、Linux/MySQL、Oracle)の違いに対応するよう構成できます。ソフトウェアはこれらすべての組合せで正しく機能しなければならないため、これら4つの主要構成項目のすべてのペアワイズ組合せに単一のテストスイートを適用できます。さまざまな構成オプションを持つシステムは、この種の試験の適切な候補となります。
Configuration coverage is perhaps the most developed form of combinatorial testing. It has been used for years with pairwise coverage, particularly for applications that must be shown to work across a variety of combinations of operating systems, databases, and network characteristics.
構成網羅は、おそらく組合せテストの中で最も発展した形態です。特に、多様なオペレーティングシステム、データベースおよびネットワーク特性の組合せ全体で動作することを示す必要があるアプリケーションでは、ペアワイズ網羅が長年使用されてきました。
For example, suppose we had an application that is intended to run on a variety of platforms comprised of five components: an operating system (Windows XP, Apple OS X, Red Hat Enterprise Linux), a browser (Internet Explorer, Firefox), protocol stack (IPv4, IPv6), a processor (Intel, AMD), and a database (MySQL, Sybase, Oracle), a total of \(3 \cdot 2 \cdot 2 \cdot 2 \cdot 3 = 72\) possible platforms. With only 10 tests, shown in Table 1, it is possible to test every component interacting with every other component at least once, i.e., all possible pairs of platform components are covered.
たとえば、次の5つのコンポーネントからなるさまざまなプラットフォームで実行するアプリケーションを考えます。オペレーティングシステム(Windows XP、Apple OS X、Red Hat Enterprise Linux)、ブラウザー(Internet Explorer、Firefox)、プロトコルスタック(IPv4、IPv6)、プロセッサー(Intel、AMD)、データベース(MySQL、Sybase、Oracle)。可能なプラットフォームの総数は\(3 \cdot 2 \cdot 2 \cdot 2 \cdot 3 = 72\)です。表1に示すわずか10件のテストで、各コンポーネントと他のすべてのコンポーネントが少なくとも1回相互作用するよう試験できます。すなわち、プラットフォームコンポーネントの可能なペアをすべて網羅できます。
| Test | OS | Browser | Protocol | CPU | DBMS |
|---|---|---|---|---|---|
| 1 | XP | IE | IPv4 | Intel | MySQL |
| 2 | XP | Firefox | IPv6 | AMD | Sybase |
| 3 | XP | IE | IPv6 | Intel | Oracle |
| 4 | OS X | Firefox | IPv4 | AMD | MySQL |
| 5 | OS X | IE | IPv4 | Intel | Sybase |
| 6 | OS X | Firefox | IPv4 | Intel | Oracle |
| 7 | RHEL | IE | IPv6 | AMD | MySQL |
| 8 | RHEL | Firefox | IPv4 | Intel | Sybase |
| 9 | RHEL | Firefox | IPv4 | AMD | Oracle |
| 10 | OS X | Firefox | IPv6 | AMD | Oracle |
| 試験 | OS | ブラウザー | プロトコル | CPU | DBMS |
|---|---|---|---|---|---|
| 1 | XP | IE | IPv4 | Intel | MySQL |
| 2 | XP | Firefox | IPv6 | AMD | Sybase |
| 3 | XP | IE | IPv6 | Intel | Oracle |
| 4 | OS X | Firefox | IPv4 | AMD | MySQL |
| 5 | OS X | IE | IPv4 | Intel | Sybase |
| 6 | OS X | Firefox | IPv4 | Intel | Oracle |
| 7 | RHEL | IE | IPv6 | AMD | MySQL |
| 8 | RHEL | Firefox | IPv4 | Intel | Sybase |
| 9 | RHEL | Firefox | IPv4 | AMD | Oracle |
| 10 | OS X | Firefox | IPv6 | AMD | Oracle |
Table 1. Pairwise test configurations
表1. ペアワイズのテスト構成
2.1.2 Input Parameter Testing
2.1.2 入力パラメータのテスト
Even if an application has no configuration options, some form of input will be processed. For example, a word processing application may allow the user to select 10 ways to modify some highlighted text: subscript, superscript, underline, bold, italic, strikethrough, emboss, shadow, small caps, or all caps. The font-processing function within the application that receives these settings as input must process the input and modify the text on the screen correctly. Most options can be combined, such as bold and small caps, but some are incompatible, such as subscript and superscript.
アプリケーションに構成オプションがない場合でも、何らかの形の入力は処理されます。たとえば、ワードプロセッサは、強調表示したテキストを修飾する10通りの方法(下付き、上付き、下線、太字、斜体、取り消し線、浮き出し、影、スモールキャップ、すべて大文字)をユーザーが選択できるようにしていることがあります。アプリケーション内で、これらの設定を入力として受け取るフォント処理機能は、その入力を処理して画面上のテキストを正しく修飾しなければなりません。ほとんどのオプションは太字とスモールキャップのように組み合わせられますが、下付きと上付きのように両立しないものもあります。
Thorough testing requires that the font-processing function work correctly for all valid combinations of these input settings. But with 10 binary inputs, there are \(2^{10} = 1{,}024\) possible combinations. But the empirical analysis reported above shows that failures appear to involve a small number of parameters, and that testing all 3-way combinations may detect 90% or more of bugs. For a word processing application, testing that detects better than 90% of bugs may be a cost-effective choice, but we need to ensure that all 3-way combinations of values are tested. To do this, we create a test suite to cover all 3-way combinations (known as a covering array) [12, 14, 23, 26, 30, 43, 63].
徹底的な試験では、フォント処理機能がこれらの入力設定の有効な組合せすべてについて正しく動作することが求められます。しかし、10個の二値入力には\(2^{10} = 1{,}024\)通りの組合せがあり得ます。一方、前述の実証分析は、障害に関与するパラメーターは少数であると見られること、およびすべての3-way組合せを試験すればバグの90%以上を検出できる可能性があることを示しています。ワープロアプリケーションでは、バグの90%超を検出する試験は費用対効果の高い選択となり得ますが、値の3-way組合せがすべて試験されることを確実にする必要があります。そのために、すべての3-way組合せを網羅するテストスイート(被覆配列と呼ばれる)を作成します [12, 14, 23, 26, 30, 43, 63]。
An example is given in Figure 3, which shows a 3-way covering array for 10 variables with two values each. The interesting property of this array is that any three columns contain all eight possible values for three binary variables. For example, taking columns F, G, and H, we can see that all eight possible 3-way combinations (000, 001, 010, 011, 100, 101, 110, 111) occur somewhere in the three columns together. In fact, any combination of three columns chosen in any order will also contain all eight possible values. Collectively, therefore, this set of tests will exercise all 3-way combinations of input values in only 13 tests, as compared with 1,024 for exhaustive coverage.
例を図3に示します。これは、それぞれ2つの値をとる10個の変数に対する3-wayの被覆配列です。この配列の興味深い性質は、任意の3列に、3つの2値変数がとりうる8通りの値がすべて含まれていることです。たとえばF、G、Hの列をとると、8通りの3-wayの組合せ(000、001、010、011、100、101、110、111)がすべて、この3列を合わせたどこかに現れることが分かります。実際、どの順序で選んでも、任意の3列の組合せには同様に8通りの値がすべて含まれます。したがって、このテスト集合全体で、入力値のすべての3-wayの組合せを、網羅的なカバレッジの1,024件に対してわずか13件のテストで実行することになります。
The key component is a covering array, which includes all t-way combinations. Each column is a parameter. Each row is a test.
中核となる要素は、すべてのt-wayの組合せを含む被覆配列です。各列がパラメータであり、各行が1件のテストです。
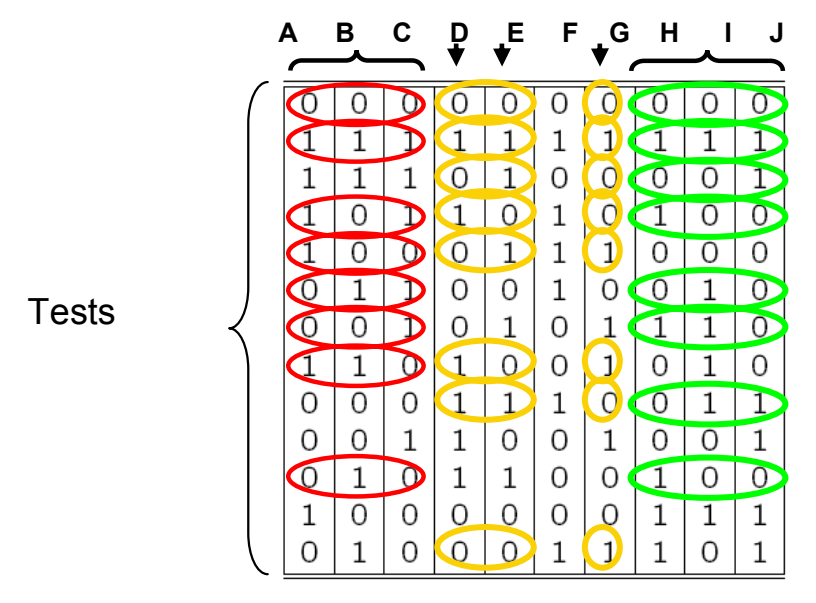
図 3. 3-way カバリングアレイ。左の波括弧で「Tests(テスト)」と示した 13 行と、A〜J の 10 列からなる表で、各セルは 0 または 1 である。各行は 0000000000、1111111111、1110100001、1011010100、1000111000、0110010010、0010101110、1101000010、0001110011、0011001001、0101100100、1000000111、0100011101。列 A・B・C は上の波括弧でまとめられ、列 D・E・G には矢印が付き、列 H・I・J も波括弧でまとめられている。赤の楕円は 8 行の列 A〜C の値を、黄の楕円は 8 行の列 D・E と列 G の値を、緑の楕円は 8 行の列 H〜J の値を囲み、それぞれの 3 列の組の 3-way の組合せを示している。
Figure 3. 3-way covering array
図 3. 3-way カバリングアレイ
Similar arrays can be generated to cover up to all 6-way combinations. In general, the number of \(t\)-way combinatorial tests that will be required is proportional to \(v^t \log n\), for \(n\) parameters with \(v\) possible values each.
同様の配列を生成して、6-way の組合せまですべてを網羅することができます。一般に、必要となる \(t\)-way 組合せテストの数は、\(v^t \log n\) に比例します。ここで \(n\) はパラメータの数、\(v\) は各パラメータの取りうる値の数です。
Figure 4 contrasts these two approaches. With the first approach, we may run the same test set against all 3-way combinations of configuration options, while for the second approach, we would construct a test suite that covers all 3-way combinations of input transaction fields. Of course these approaches could be combined, with the combinatorial tests (approach 2) run against all the configuration combinations (approach 1).
図4はこの2つの方法を対比しています。第1の方法では、構成オプションのすべての3-way組合せに対して同じテストセットを実行します。これに対し第2の方法では、入力トランザクションフィールドのすべての3-way組合せを網羅するテストスイートを構築します。もちろん、これらの方法を組み合わせ、組合せテスト(方法2)をすべての構成組合せ(方法1)に対して実行することもできます。
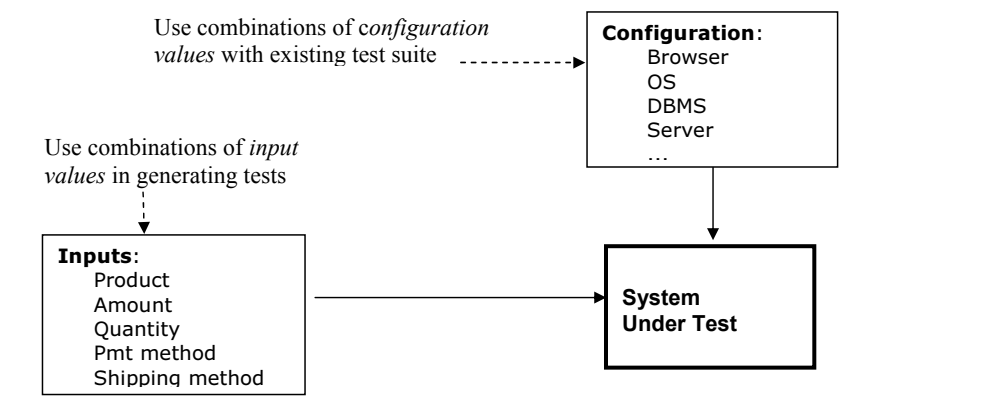
図4. 組合せテストの2つの使い方。2 つの箱から、太枠で「System Under Test(テスト対象システム)」と記した箱へ入力する図である。右上の「Configuration(構成):」の箱には Browser、OS、DBMS、Server と省略記号が並び、そこから実線の矢印がテスト対象システムへ下りている。左下の「Inputs(入力):」の箱には Product、Amount、Quantity、Pmt method(支払方法)、Shipping method(配送方法)が並び、そこから実線の矢印がテスト対象システムへ右向きに伸びている。「構成値の組合せを既存のテストスイートで使う」という注記から破線の矢印が右の Configuration の箱を指し、「テスト生成で入力値の組合せを使う」という注記から破線の矢印が下の Inputs の箱を指している。
Figure 4. Two ways of using combinatorial testing
図 4. 組合せテストの 2 つの使い方
2.2 The Test Oracle Problem
2.2 テストオラクル問題
Even with efficient algorithms to produce covering arrays, the oracle problem remains – testing requires both test data and results that should be expected for each data input. High interaction strength combinatorial testing may require a large number of tests in some cases, although not always. Approaches to solving the oracle problem for combinatorial testing include:
被覆配列を生成する効率的なアルゴリズムがあっても、オラクル問題は残ります。試験には、テストデータと、各入力データに対して期待される結果の両方が必要です。相互作用強度の高い組合せテストでは、常にではありませんが、多数のテストが必要となる場合があります。組合せテストにおけるオラクル問題を解決する方法には、次のものがある:
Crash testing: the easiest and least expensive approach is to simply run tests against the system under test (SUT) to check whether any unusual combination of input values causes a crash or other easily detectable failure. This is essentially the same procedure used in “fuzz testing”, which sends random values against the SUT. This form of combinatorial testing could be regarded as a disciplined form of fuzz testing [59]. It should be noted that although pure random testing will generally cover a high percentage of t-way combinations, 100% coverage of combinations requires a random test set much larger than a covering array. For example, all 3-way combinations of 10 parameters with 4 values each can be covered with 151 tests. Purely random generation requires over 900 tests to provide full 3-way coverage.
クラッシュテスト: 最も簡単で費用が最も少ない方法は、テスト対象システム(SUT)に対して単にテストを実行し、入力値の何らかの異常な組合せがクラッシュなどの容易に検出できる障害を引き起こさないかを確認することです。これは基本的に、SUT に対してランダムな値を送る「ファズテスト」で用いられる手順と同じです。この形の組合せテストは、規律あるファズテストの一種とみなせます [59]。ただし、純粋なランダムテストでも、一般に t-way 組合せの高い割合を網羅できますが、組合せを 100% 網羅するには、カバリングアレイよりはるかに大きなランダムテスト集合が必要になる点に注意すべきです。例えば、それぞれ 4 つの値を持つ 10 個のパラメータのすべての 3-way 組合せは、151 個のテストで網羅できます。純粋にランダムに生成する場合、3-way を完全に網羅するには 900 個を超えるテストが必要になります。
Embedded assertions: An increasingly popular “light-weight formal methods” technique is to embed assertions within code to ensure proper relationships between data, for example as preconditions, postconditions, or input value checks. Tools such as the Java Modeling language (JML) can be used to introduce very complex assertions, effectively embedding a formal specification within the code. The embedded assertions serve as an executable form of the specification, thus providing an oracle for the testing phase. With embedded assertions, exercising the application with all t-way combinations can provide reasonable assurance that the code works correctly across a very wide range of inputs. This approach has been used successfully for testing smart cards, with embedded JML assertions acting as an oracle for combinatorial tests [25]. Results showed that 80% - 90% of errors could be found in this way.
組み込みアサーション: ますます普及している「軽量形式手法」の技法に、データ間の適切な関係(例えば事前条件、事後条件、入力値のチェック)を確保するために、コード内にアサーションを組み込む方法があります。Java Modeling Language(JML)などのツールを使うと、非常に複雑なアサーションを導入でき、形式仕様を事実上コード内に組み込めます。組み込まれたアサーションは仕様の実行可能な形式として機能し、テスト段階のオラクルとなります。組み込みアサーションがあれば、アプリケーションをすべての t-way 組合せで実行することで、コードが非常に広範な入力にわたって正しく動作するという妥当な保証が得られます。この手法は、組み込みの JML アサーションを組合せテストのオラクルとして用いるスマートカードのテストに成功裏に使われています [25]。結果は、この方法で誤りの 80%〜90% を発見できることを示しました。
Model based test generation uses a mathematical model of the SUT and a simulator or model checker to generate expected results for each input [1,8,9,52,55]. If a simulator can be used, expected results can be generated directly from the simulation, but model checkers are widely available and can also be used to prove properties such as liveness in parallel processes, in addition to generating tests. Conceptually, a model checker can be viewed as exploring all states of a system model to determine if a property claimed in a specification statement is true. What makes a model checker particularly valuable is that if the claim is false, the model checker not only reports this, but also provides a “counterexample” showing how the claim can be shown false. If the claim is false, the model checker indicates this and provides a trace of parameter input values and states that will prove it is false. In effect this is a complete test case, i.e., a set of parameter values and expected result. It is then simple to map these values into complete test cases in the syntax needed for the system under test. Later chapters develop detailed procedures for applying each of these testing approaches.
モデルベースのテスト生成では、SUT の数学的モデルとシミュレータまたはモデル検査器を用いて、各入力に対する期待結果を生成します [1,8,9,52,55]。シミュレータを使用できる場合、シミュレーションから期待結果を直接生成できます。一方、モデル検査器は広く利用可能であり、テストを生成するだけでなく、並列プロセスにおける活性などの性質を証明するためにも使用できます。概念的には、モデル検査器はシステムモデルのすべての状態を探索し、仕様記述で主張された性質が真かどうかを判定するものとみなせます。モデル検査器が特に有用なのは、主張が偽の場合、その旨を報告するだけでなく、その主張が偽であることを示す方法を示した「反例」も提供する点です。主張が偽の場合、モデル検査器はそれを示すパラメータ入力値と状態のトレースを提供します。これは事実上、完全なテストケース、すなわちパラメータ値の集合と期待結果です。次に、これらの値をテスト対象システムに必要な構文の完全なテストケースに対応付けるのは容易です。後の章では、これら各テスト手法を適用する詳細な手順を述べます。
Several types of test oracle can be used, depending on resources and the system under test.
リソースとテスト対象システムに応じて、数種類のテストオラクルを使用できます。
2.3 Chapter Summary
2.3 章のまとめ
1. Empirical data suggest that software failures are caused by the interaction of relatively few parameter values, and that the proportion of failures attributable to \(t\)-way interactions declines very rapidly with increase in \(t\). That is, usually single parameter values or a pair of values are the cause of a failure, but increasingly smaller proportions are caused by 3-way, 4-way, and higher order interactions.
1. 実証データは、ソフトウェア障害が比較的少数のパラメーター値の相互作用によって引き起こされること、および\(t\)-way相互作用に起因する障害の割合が\(t\)の増加に伴って非常に急速に低下することを示唆しています。すなわち、通常は単一のパラメーター値または値のペアが障害の原因であり、3-way、4-way、およびそれより高次の相互作用に起因する割合は次第に小さくなります。
2. Because a small number of parameters are involved in failures, we can attain a high degree of assurance by testing all \(t\)-way interactions, for an appropriate interaction strength \(t\) (2 to 6 usually). The number of \(t\)-way tests that will be required is proportional to \(v^t \log n\), for \(n\) parameters with \(v\) values each.
2. 障害に関与するパラメーターは少数であるため、適切な相互作用強度についてすべての\(t\)-way相互作用を試験することにより、高い保証度を達成できます。ここで相互作用強度は\(t\)(通常2~6)です。必要となる\(t\)-wayテストの数は\(v^t \log n\)に比例します。ここで、パラメーターは\(n\)個であり、それぞれが\(v\)個の値を持ちます。
3.Combinatorial methods can be applied to configurations or to input parameters, or in some cases both.
3.組合せ手法は、構成パラメーターまたは入力パラメーター、場合によっては両方に適用できます。
4.4. As with all other types of testing, the oracle problem must be solved – i.e., for every test input, the expected output must be determined in order to check if the application is producing the correct result for each set of inputs. A variety of methods are available to solve the oracle problem.
4.4. 他のすべての種類の試験と同様に、オラクル問題を解決しなければなりません。すなわち、アプリケーションが各入力集合に対して正しい結果を生成しているかを確認するために、すべてのテスト入力について期待される出力を決定しなければなりません。オラクル問題を解決する方法はさまざまなものが利用できます。
3 CONFIGURATION TESTING
3 構成テスト
This chapter presents worked examples illustrating development of test configurations. As will be seen, the advantages of combinatorial testing increase with the size of the problem.
本章では、テスト構成の作成方法を示す実例を紹介します。これから分かるように、問題の規模が大きいほど、組合せテストの利点も大きくなります。
3.1 Simple Application Platform Example
3.1 単純なアプリケーションプラットフォームの例
Returning to the simple example introduced in Chapter 2, we illustrate development of test configurations, and compare the size of test suites for various interaction strengths versus testing all possible configurations. For the five configuration parameters, we have \(3 \cdot 2 \cdot 2 \cdot 2 \cdot 3 = 72\) configurations. The convention for describing the variables and values in combinatorial testing is \(v_1^{n1} v_2^{n2} \ldots\) where the \(v_i\) are number of variable values and \(n_i\) are
第2章で紹介した簡単な例に戻り、テスト構成の作成方法を示し、さまざまな相互作用強度におけるテストスイートの規模を、可能なすべての構成を試験する場合と比較します。5つの構成パラメーターについて、\(3 \cdot 2 \cdot 2 \cdot 2 \cdot 3 = 72\)通りの構成があります。組合せテストで変数と値を表す慣例は、\(v_1^{n1} v_2^{n2} \ldots\)のように記述します。ここで\(v_i\)は変数値の個数、\(n_i\)は
number of occurrences. Thus this configuration is designated \(2^3 3^2\). Note that at \(t = 5\), the number of tests is the same as exhaustive testing for this example, because there are only five parameters. The savings as a percentage of exhaustive testing are good, but not that impressive for this small example. With larger systems the savings can be enormous, as will be seen in the next section.
出現回数を示します。したがって、この構成は\(2^3 3^2\)と表されます。\(t = 5\)では、パラメーターが5つしかないため、この例のテスト数は全数試験と同じである点に注意されました。全数試験に対する削減率は良好ですが、この小さな例ではそれほど大きくありません。次節で見るように、より大規模なシステムでは削減効果が非常に大きくなり得ます。
| Parameter | Values |
|---|---|
| Operating system | XP, OS X, RHL |
| Browser | IE, Firefox |
| Protocol | IPv4, IPv6 |
| CPU | Intel, AMD |
| DBMS | MySQL, Sybase, Oracle |
| パラメーター | 値 |
|---|---|
| オペレーティングシステム | XP, OS X, RHL |
| ブラウザー | IE, Firefox |
| プロトコル | IPv4, IPv6 |
| CPU | Intel, AMD |
| DBMS | MySQL, Sybase, Oracle |
Table 2. Simple example configuration options.
表2. 構成オプションの簡単な例
We can now generate test configurations using the ACTS tool. For simplicity of presentation we illustrate usage of the command line version of ACTS, but an intuitive GUI version is available that may be more convenient. This tool is summarized in Appendix C and a comprehensive user manual is included with the ACTS download.
次に、ACTSツールを用いてテスト構成を生成します。説明を簡単にするためにACTSのコマンドライン版の使い方を示しますが、より使いやすい場合がある直観的なGUI版も利用できます。このツールの概要は付録Cに示しており、包括的なユーザマニュアルはACTSのダウンロードに含まれています。
The first step in creating test configurations is to specify the parameters and possible values in a file for input to ACTS, as shown in Figure 5:
テスト構成を作成する最初の手順は、図5に示すように、ACTSへの入力となるファイルにパラメーターと取り得る値を指定することである:
[System]
[System]
[Parameter] OS (enum): XP,OS_X,RHL Browser (enum): IE, Firefox Protocol(enum): IPv4,IPv6 CPU (enum): Intel,AMD DBMS (enum): MySQL,Sybase,Oracle
[Parameter] OS (enum): XP,OS_X,RHL Browser (enum): IE, Firefox Protocol(enum): IPv4,IPv6 CPU (enum): Intel,AMD DBMS (enum): MySQL,Sybase,Oracle
[Relation] [Constraint] [Misc]
[Relation] [Constraint] [Misc]
Figure 5. Simple example input file for ACTS.
図5. ACTS向け単純な入力ファイルの例。
Note that most of the bracketed tags in the input file are optional, and not filled in for this example. The essential part of the file is the [Parameter] specification, in the format <parameter name> (<type>): <values>, where one or more values are listed separated by commas. The tool can then be run at the command line:
入力ファイルの角括弧付きタグの大半は省略可能であり、この例では記入されていない点に注意されました。ファイルの必須部分は、<parameter name> (<type>): <values> という形式の[Parameter]指定であり、1つ以上の値をコンマで区切って列挙します。その後、ツールをコマンドラインから次のように実行できます。
java -Ddoi=2 –jar acts_cmd.jar ActsConsoleManager in.txt out.txt
java -Ddoi=2 –jar acts_cmd.jar ActsConsoleManager in.txt out.txt
A variety of options can be specified, but for this example we only use the “degree of interaction” option to specify 2-way, 3-way, etc. coverage. Output can be created in a convenient form shown below, or as a matrix of numbers, comma separated value, or Excel spreadsheet form. If the output will be used by human testers rather than as input for further machine processing, the format in Figure 6 is useful:
さまざまなオプションを指定できますが、この例では、2-way、3-wayなどのカバレッジを指定する「相互作用の次数」オプションだけを使います。出力は、以下に示す読みやすい形式のほか、数値の行列、コンマ区切り値、Excelスプレッドシートの形式でも作成できます。出力をさらなる機械処理の入力としてではなく、人間のテスト担当者が使う場合には、図6の形式が便利です。
Figure 6. Excerpt of test configuration output covering all 2-way combinations.
図6. すべての2-wayの組合せを網羅するテスト構成の出力の抜粋。
The complete test set for 2-way combinations is shown in Table 1 in Section 2.1.1. Only 10 tests are needed. Moving to 3-way or higher interaction strengths requires more tests, as shown in Table 3.
2-wayの組合せに対する完全なテスト集合は、2.1.1節の表1に示しています。必要なテストは10件だけです。3-way以上の相互作用強度にすると、表3に示すとおり、より多くのテストが必要になります。
| t | # Tests | % of Exhaustive |
|---|---|---|
| 2 | 10 | 14 |
| 3 | 18 | 25 |
| 4 | 36 | 50 |
| 5 | 72 | 100 |
| t | テスト数 | 網羅テストに対する割合(%) |
|---|---|---|
| 2 | 10 | 14 |
| 3 | 18 | 25 |
| 4 | 36 | 50 |
| 5 | 72 | 100 |
Table 3. Number of combinatorial tests for a simple example.
表3. 簡単な例における組合せテストの件数。
In this example, substantial savings could be realized by testing \(t\)-way configurations instead of all possible configurations, although for some applications (such as a small but highly critical module) a full exhaustive test may be warranted. As we will see in the next example, in many cases it is impossible to test all configurations, so we need to develop reasonable alternatives.
この例では、可能な構成をすべてテストする代わりに\(t\)-way構成をテストすることで、大幅な節約を実現できます。ただし、一部のアプリケーション(小規模だが極めて重要なモジュールなど)では、完全な全数テストが妥当な場合もあります。次の例で見るように、多くの場合、すべての構成をテストすることは不可能であるため、妥当な代替策を考案する必要があります。
3.2 Smart Phone Application Example
3.2 スマートフォンアプリケーションの例
Smart phones have become enormously popular because they combine communication capability with powerful graphical displays and processing capability. Literally tens of thousands of smart phone applications, or ‘apps’, are developed annually. Among the platforms for smart phone apps is the Android, which includes an open source development environment and specialized operating system. Android units contain a large number of configuration options that control the behavior of the device. Android apps must operate across a variety of hardware and software platforms, since not all products support the same options. For example, some smart phones may have a physical keyboard and others may present a soft keyboard using the touch sensitive screen. Keyboards may also be either only numeric with a few special keys, or a full typewriter keyboard. Depending on the state of the app and user choices, the keyboard may be visible or hidden. Ensuring that a particular app works across the enormous number of options is a significant challenge for developers. The extensive set of options makes it intractable to test all possible configurations, so combinatorial testing is a practical alternative.
スマートフォンは、通信機能と、高性能なグラフィック表示および処理能力とを兼ね備えているため、非常に普及しています。毎年、文字どおり数万ものスマートフォンアプリケーション(アプリ)が開発されています。スマートフォン向けアプリのプラットフォームの1つにAndroidがあり、オープンソースの開発環境と特化したオペレーティングシステムを備えます。Android端末には、端末の挙動を制御する多数の構成オプションがあります。すべての製品が同じオプションに対応しているわけではないため、Androidアプリは多様なハードウェアおよびソフトウェアのプラットフォームにわたって動作しなければなりません。たとえば、物理キーボードを備えるスマートフォンもあれば、タッチ操作対応の画面にソフトキーボードを表示するものもあります。キーボードも、数字キーと少数の特殊キーだけを備えるもの、またはタイプライター式のキー一式を備えるものがあります。アプリの状態やユーザーの選択に応じて、キーボードは表示されることも隠れることもあります。特定のアプリが膨大なオプションの組合せにわたって動作することを確かめるのは、開発者にとって大きな課題です。オプションの集合が広範であるため、可能なすべての構成をテストするのは現実的でなく、組合せテストが実用的な代替策となります。
Figure 7 shows a resource configuration file for Android apps. A total of 35 options may be set. Our task is to develop a set of test configurations that allow testing across all 4-way combinations of these options. The first step is to determine the set of parameters and possible values for each that will be tested. Although the options are listed individually to allow a specific integer value to be associated with each, they clearly represent sets of option values with mutually exclusive choices. For example, “Keyboard Hidden” may be “yes”, “no”, or “undefined”. These values will be the possible settings for parameter names that we will use in generating a covering array. Table 4 shows the parameter names and number of possible values that we will use for input to the covering array generator. For a complete specification of these parameters, see: http://developer.android.com/reference/android/content/res/Configuration.html
図7は、Androidアプリのリソース構成ファイルを示しています。設定できるオプションは全部で35個あります。我々の課題は、これらのオプションのすべての4-wayの組合せにわたってテストできる、テスト構成の集合を作成することです。最初のステップは、テスト対象のパラメータの集合と、それぞれのとりうる値を決定することです。オプションは、それぞれに特定の整数値を対応づけられるように個別に列挙されていますが、実際には、互いに排他的な選択肢をもつオプション値の集合を表していることは明らかです。たとえば「Keyboard Hidden」は「yes」「no」「undefined」のいずれかです。これらの値が、被覆配列の生成に用いるパラメータ名のとりうる設定値となります。表4は、被覆配列生成器への入力として用いるパラメータ名と、とりうる値の個数を示しています。これらのパラメータの完全な仕様については、次を参照のこと:http://developer.android.com/reference/android/content/res/Configuration.html
Figure 7. Android resource configuration file.
図7. Androidリソース構成ファイル。
| Parameter Name | Values | # Values |
|---|---|---|
| HARDKEYBOARDHIDDEN | NO, UNDEFINED, YES | 3 |
| KEYBOARDHIDDEN | NO, UNDEFINED, YES | 3 |
| KEYBOARD | 12KEY, NOKEYS, QWERTY, UNDEFINED | 4 |
| NAVIGATIONHIDDEN | NO, UNDEFINED, YES | 3 |
| NAVIGATION | DPAD, NONAV, TRACKBALL, UNDEFINED, WHEEL | 5 |
| ORIENTATION | LANDSCAPE, PORTRAIT, SQUARE, UNDEFINED | 4 |
| SCREENLAYOUT_LONG | MASK, NO, UNDEFINED, YES | 4 |
| SCREENLAYOUT_SIZE | LARGE, MASK, NORMAL, SMALL, UNDEFINED | 5 |
| TOUCHSCREEN | FINGER, NOTOUCH, STYLUS, UNDEFINED | 4 |
| パラメーター名 | 値 | 値の数 |
|---|---|---|
| HARDKEYBOARDHIDDEN | NO, UNDEFINED, YES | 3 |
| KEYBOARDHIDDEN | NO, UNDEFINED, YES | 3 |
| KEYBOARD | 12KEY, NOKEYS, QWERTY, UNDEFINED | 4 |
| NAVIGATIONHIDDEN | NO, UNDEFINED, YES | 3 |
| NAVIGATION | DPAD, NONAV, TRACKBALL, UNDEFINED, WHEEL | 5 |
| ORIENTATION | LANDSCAPE, PORTRAIT, SQUARE, UNDEFINED | 4 |
| SCREENLAYOUT_LONG | MASK, NO, UNDEFINED, YES | 4 |
| SCREENLAYOUT_SIZE | LARGE, MASK, NORMAL, SMALL, UNDEFINED | 5 |
| TOUCHSCREEN | FINGER, NOTOUCH, STYLUS, UNDEFINED | 4 |
Table 4. Android configuration options.
表4. Androidの構成オプション。
Using Table 4, we can now calculate the total number of configurations: \(3 \cdot 3 \cdot 4 \cdot 3 \cdot 5 \cdot 4 \cdot 4 \cdot 5 \cdot 4 = 172{,}800\) configurations (i.e., a \(3^3 4^4 5^2\) system). Like many applications, thorough testing will require some human intervention to run tests and verify results, and a test suite will typically include many tests. If each test suite can be run in 15 minutes, it will take roughly 24 staff-years to complete testing for an app. With salary and benefit costs for each tester of $150,000, the cost of testing an app will be more than $3 million, making it virtually impossible to return a profit for most apps. How can we provide effective testing for apps at a reasonable cost?
表4を用いると、構成の総数を計算できる: \(3 \cdot 3 \cdot 4 \cdot 3 \cdot 5 \cdot 4 \cdot 4 \cdot 5 \cdot 4 = 172{,}800\)通りの構成(すなわち、\(3^3 4^4 5^2\)システム)。多くのアプリケーションと同様に、徹底的なテストでは、テストを実行し結果を検証するために人手の介入がある程度必要となり、テストスイートには通常多数のテストが含まれます。各テストスイートを15分で実行できるとすると、1つのアプリのテストを完了するのにおよそ24人年かかります。テスター1人あたりの給与および福利厚生費を150,000ドルとすると、1つのアプリのテスト費用は300万ドルを超え、大半のアプリでは利益を上げることが事実上不可能になります。どうすれば妥当な費用でアプリを効果的にテストできるだろうか。
Using the covering array generator, we can produce tests that cover \(t\)-way combinations of values. Table 5 shows the number of tests required at several levels of \(t\). For many applications, 2-way or 3-way testing may be appropriate, and either of these will require less than 1% of the time required to cover all possible test configurations.
被覆配列生成器を用いると、値の\(t\)-way組合せを網羅するテストを生成できます。表5に、いくつかの\(t\)の水準で必要となるテスト数を示します。多くのアプリケーションでは2-wayまたは3-wayテストが適切であると考えられ、そのいずれも、可能なテスト構成をすべて網羅するのに必要な時間の1%未満で済みます。
| t | # Tests | % of Exhaustive |
|---|---|---|
| 2 | 29 | 0.02 |
| 3 | 137 | 0.08 |
| 4 | 625 | 0.4 |
| 5 | 2532 | 1.5 |
| 6 | 9168 | 5.3 |
| t | テスト数 | 網羅テストに対する割合(%) |
|---|---|---|
| 2 | 29 | 0.02 |
| 3 | 137 | 0.08 |
| 4 | 625 | 0.4 |
| 5 | 2532 | 1.5 |
| 6 | 9168 | 5.3 |
Table 5. Number of combinatorial tests for Android example.
表5. Androidの例における組合せテスト数。
3.3 Cost and Practical Considerations
3.3 コストおよび実務上の考慮事項
3.3.1 Invalid Combinations and Constraints
3.3.1 無効な組合せと制約
The system described in Section 3.1 illustrates a common situation in all types of testing: some combinations cannot be tested because they don’t exist for the systems under test. In this case, if the operating system is either OS X or Linux, Internet Explorer is not available as a browser. Note that we cannot simply delete tests with these untestable combinations, because that would result in losing other combinations that are essential to test but are not covered by other tests. For example, deleting tests 5 and 7 in Section 2.1.1 would mean that we would also lose the test for Linux with the IPv6 protocol.
第3.1節で説明したシステムは、あらゆる種類のテストに共通する状況を示しています。すなわち、テスト対象システムには存在しないためにテストできない組合せがあります。この例では、オペレーティングシステムがOS XまたはLinuxの場合、ブラウザーとしてInternet Explorerを利用できません。こうしたテスト不能な組合せを含むテストを単純に削除することはできない点に注意します。削除すると、テストが不可欠でありながら他のテストでは網羅されていない別の組合せまで失われるからです。たとえば、第2.1.1節のテスト5と7を削除すると、LinuxとIPv6プロトコルの組合せに対するテストも失われることになります。
One way around this problem is to delete tests and supplement the test suite with manually constructed test configurations to cover the deleted combinations, but covering array tools offer a better solution. With ACTS we can specify constraints, which tell the tool not to include specified combinations in the generated test configurations. ACTS supports a set of commonly used logic and arithmetic operators to specify constraints. In this case, the following constraint can be used to ensure that invalid combinations are not generated:
この問題を回避する一つの方法は、テストを削除し、削除された組合せを網羅するために手作業で構築したテスト構成でテストスイートを補うことですが、カバリング配列ツールはより良い解決策を提供します。ACTSでは制約を指定できます。制約は、生成されるテスト構成に指定した組合せを含めないようツールに指示するものです。ACTSは、制約を指定するために、一般的に用いられる論理演算子および算術演算子の集合をサポートしています。この場合、無効な組合せが生成されないようにするには、次の制約を用いることができます。
Some combinations never occur in practice.
一部の組合せは実際には決して生じない。
(OS != “XP” => Browser = “Firefox”)
(OS != “XP” => Browser = “Firefox”)
The covering array tool will then generate a set of test configurations that does not include the invalid combinations, but does cover all those that are essential. The revised test configuration array is shown in Figure 8 below. Parameter values that have changed from the original configurations are underlined. Note that adding the constraint also resulted in reducing the number of test configurations by one. This will not always be the case, depending on the constraints used, but it illustrates how constraints can help reduce the problem. Even if particular combinations are testable, the test team may consider some combinations unnecessary, and constraints could be used to prevent these combinations, possibly reducing the number of test configurations.
その後、カバリングアレイツールは無効な組合せを含まず、必須の組合せをすべて網羅するテスト構成セットを生成します。改訂後のテスト構成アレイを以下の図8に示します。元の構成から変更されたパラメータ値には下線が引かれています。制約を追加した結果、テスト構成数も1件減少しました。制約によって常にテスト数が減るとは限らず、使用する制約に依存しますが、制約が問題を軽減できることを示します。特定の組合せがテスト可能であっても、テストチームが不要と判断する場合があり、そのような組合せを防ぐ制約を使えば、テスト構成数を減らせる可能性があります。
| Test | OS | Browser | Protocol | CPU | DBMS |
|---|---|---|---|---|---|
| 1 | XP | IE | IPv4 | Intel | MySQL |
| 2 | XP | Firefox | IPv6 | AMD | Sybase |
| 3 | XP | IE | IPv6 | Intel | Oracle |
| 4 | OS X | Firefox | IPv4 | AMD | MySQL |
| 5 | OS X | Firefox | IPv4 | Intel | Sybase |
| 6 | OS X | Firefox | IPv6 | AMD | Oracle |
| 7 | RHL | Firefox | IPv6 | Intel | MySQL |
| 8 | RHL | Firefox | IPv4 | Intel | Oracle |
| 9 | XP | IE | IPv4 | AMD | Sybase |
| テスト | OS | ブラウザー | プロトコル | CPU | DBMS |
|---|---|---|---|---|---|
| 1 | XP | IE | IPv4 | Intel | MySQL |
| 2 | XP | Firefox | IPv6 | AMD | Sybase |
| 3 | XP | IE | IPv6 | Intel | Oracle |
| 4 | OS X | Firefox | IPv4 | AMD | MySQL |
| 5 | OS X | Firefox | IPv4 | Intel | Sybase |
| 6 | OS X | Firefox | IPv6 | AMD | Oracle |
| 7 | RHL | Firefox | IPv6 | Intel | MySQL |
| 8 | RHL | Firefox | IPv4 | Intel | Oracle |
| 9 | XP | IE | IPv4 | AMD | Sybase |
Figure 8. Test configurations for simple example with constraint.
図8. 制約を加えた単純な例のテスト構成。
3.3.2 Cost Factors
3.3.2 コスト要因
Using combinatorial methods to design test configurations is probably the most widely used combinatorial approach because it is quick and easy to do and typically delivers significant improvements to testing. Combinatorial testing for input parameters can provide better test coverage at lower cost than conventional tests, and can be extended to high strength coverage to provide much better assurance.
テスト構成の設計に組合せ手法を用いるのは、おそらく最も広く利用される組合せアプローチです。迅速かつ簡単に実施でき、通常テストを大幅に改善できるためです。入力パラメーターに組合せテストを用いると、従来型テストより低コストで優れたテスト網羅性を実現でき、高強度の網羅まで拡張してはるかに高い保証を提供できます。
3.4 Chapter Summary
3.4 章のまとめ
1.Configuration testing is probably the most commonly used application of combinatorial methods in software testing. Whenever an application has roughly five or more configurable attributes, a covering array is likely to make testing more efficient. Configurable attributes usually have a small number of possible values each, which is an ideal situation for combinatorial methods. Because the number of t-way tests is proportional to \(v^t \log n\), for \(n\) parameters with \(v\) values each, unless configurable attributes have more than 8 or 10 possible values each, the number of tests generated will probably be reasonable. The real-world testing problem introduced in Section 3.2 is a fairly typical size, where 4-way interactions can be tested with a few hundred tests.
1.構成テストは、ソフトウェアテストにおける組合せ手法の適用として、おそらく最も一般的に用いられています。アプリケーションにおよそ5個以上の構成可能属性がある場合は常に、カバリングアレイによってテストの効率が向上する可能性が高いです。構成可能属性は通常、それぞれが取りうる値の数が少なく、組合せ手法にとって理想的な状況です。\(n\)個のパラメータがそれぞれ\(v\)個の値を持つとき、t-wayテスト数は\(v^t \log n\)に比例するため、各構成可能属性が取りうる値が8個または10個を超えない限り、生成されるテスト数はおそらく妥当な範囲に収まります。第3.2節で示した実世界のテスト課題は典型的な規模であり、数百件のテストで4-way相互作用をテストできます。
2.Because many systems have certain configurations that may not be of interest (such as Internet Explorer browser on a Linux system), constraints are an important consideration in any type of testing. With combinatorial methods, it is important that the covering array generator allows for the inclusion of constraints so that all relevant interactions are tested, and important information is not lost because a test contains an impossible combination.
2.Linuxシステム上のInternet Explorerなど、多くのシステムでは関心対象とならない構成があるため、制約はあらゆる種類のテストで重要な考慮事項です。組合せ手法では、関連する相互作用をすべてテストし、不可能な組合せを含むテストによって重要な情報が失われないよう、カバリングアレイ生成器が制約を含められることが重要です。
4 INPUT PARAMETER TESTING
4 入力パラメータのテスト
As noted in the introduction, the key advantage of combinatorial testing derives from the fact that all, or nearly all, software failures appear to involve interactions of only a few parameters. Using combinatorial testing to select configurations can make testing more efficient, but it can be even more effective when used to select input parameter values. Testers traditionally develop scenarios of how an application will be used, then select inputs that will exercise each of the application features using representative values, normally supplemented with extreme values to test performance and reliability. The problem with this often ad hoc approach is that unusual combinations will usually be missed, so a system may pass all tests and work well under normal circumstances, but eventually encounter a combination of inputs that it fails to process correctly.
序論で述べたように、組合せテストの主な利点は、ソフトウェア障害のすべて、またはほぼすべてに、ごく少数のパラメータの相互作用が関与しているとみられるという事実に由来します。組合せテストを用いて構成を選択すればテストを効率化できますが、入力パラメータの値の選択に用いればさらに効果的になりうます。テスト担当者は従来、アプリケーションがどのように使われるかのシナリオを作成し、代表的な値を用いてアプリケーションの各機能を動作させる入力を選択します。通常これに、性能と信頼性をテストするための極端な値を補います。この、しばしば場当たり的なアプローチの問題は、通常と異なる組合せが見落とされがちなことです。そのため、システムはすべてのテストに合格し、通常の状況では問題なく動作しても、最終的には正しく処理できない入力の組合せに遭遇する場合があります。
By testing all \(t\)-way combinations, for some specified level of \(t\), combinatorial testing can help to avoid this type of situation. In this chapter we work through a small example to illustrate the use of these methods.
指定した\(t\)の水準についてすべての\(t\)-way組合せをテストすることにより、組合せテストはこの種の状況を避ける助けとなります。本章では、これらの手法の使い方を示すために、小さな例を順を追って説明します。
4.1 Example Access Control Module
4.1 アクセス制御モジュールの例
The system under test is an access control module that implements the following policy:
テスト対象のシステムは、次のポリシーを実装するアクセス制御モジュールです。
Access is allowed if and only if:
アクセスは、次の条件が成り立つ場合、かつその場合に限り許可されます。
•the subject is an employee AND current time is between 9 am and 5 pm AND it is not a weekend
•主体が従業員であり、かつ現在時刻が午前9時から午後5時の間であり、かつ週末ではない
•OR subject is an employee with a special authorization code
•または、主体が特別な認可コードをもつ従業員である
•OR subject is an auditor AND the time is between 9 am and 5 pm (not constrained to weekdays).
•または、主体が監査人であり、かつ時刻が午前9時から午後5時の間です(平日に限定されません)。
The input parameters for this module are shown in Figure 9:
このモジュールの入力パラメータを図9に示します。
Figure 9. Access control module input parameters.
図9. アクセス制御モジュールの入力パラメータ。
Our task is to develop a covering array of tests for these inputs. The first step will be to develop a table of parameters and possible values, similar to that in Section 3.1 in the previous chapter. The only difference is that in this case we are dealing with input parameters rather than configuration options. For the most part, the task is simple: we just take the values directly from the specifications or code, as shown in Figure 10. Several parameters are boolean, and we will use 0 and 1 for false and true values respectively. For day of the week, there are only seven values, so these can all be used. However, hour of the day presents a problem. Recall that the number of tests generated for \(n\) parameters is proportional to \(v^t\), where \(v\) is the number of values and \(t\) is the interaction level (2-way to 6-way). For all boolean values and 4-way testing, therefore, the number of tests will be some multiple of \(2^4\). But consider what happens with a large number of possible values, such as 24 hours. The number of tests will be proportional to \(24^4\) = 331,736. For this example, time is given in minutes, which would obviously be completely intractable. Therefore, we must select representative values for the hour parameter. This problem occurs in all types of testing, not just with combinatorial methods, and good methods have been developed to deal with it. Most testers are already familiar with two of these: equivalence partitioning and boundary value analysis. Additional background on these methods can be found in software testing texts such as Ammann and Offutt [2], Beizer [4], Copeland [21], Mathur [45], and Myers [52].
課題は、これらの入力に対するテストの被覆配列を作ることです。最初に、前章の3.1節と同様に、パラメーターと取り得る値の表を作ります。唯一の違いは、今回は構成オプションではなく入力パラメーターを扱うことです。作業の大部分は単純であり、図10に示すように、仕様やコードから値を直接取り出せば足ります。いくつかのパラメーターはブール値であり、偽と真にそれぞれ0と1を用います。曜日の値は7つだけなので、すべて使えます。しかし、時刻には問題があります。\(n\)個のパラメーターに対して生成されるテスト数は\(v^t\)に比例することを思い出してください。ここで、\(v\)は値の数、\(t\)は相互作用の水準(2-wayから6-way)です。したがって、すべてブール値で4-wayテストを行う場合、テスト数は\(2^4\)の何倍かとなります。しかし、24時間のように取り得る値が多い場合を考えると、テスト数は\(24^4\) = 331,736に比例します。この例では時刻を分単位で与えるため、明らかに扱い切れない規模になります。したがって、時刻パラメーターの代表値を選ばなければなりません。この問題は、組合せの手法だけでなく、あらゆる種類のテストに生じ、その対処法として優れた手法が開発されています。ほとんどのテスターは、そのうちの同値分割と境界値分析を既に知っています。これらの手法の背景は、AmmannとOffutt [2]、Beizer [4]、Copeland [21]、Mathur [45]、Myers [52]などのソフトウェアテストの教科書で詳しく説明されています。
| Parameter | Values |
|---|---|
| emp | 0,1 |
| time | ?? |
| day | m,tu,w,th,f,sa,su |
| auth | 0, 1 |
| aud | 0, 1 |
| パラメーター | 値 |
|---|---|
| emp | 0,1 |
| time | ?? |
| day | m,tu,w,th,f,sa,su |
| auth | 0, 1 |
| aud | 0, 1 |
Figure 10. Parameters and values for access control example.
図10. アクセス制御の例におけるパラメーターと値。
Both of these intuitively obvious methods will produce a smaller set of values that should be adequate for testing purposes, by dividing the possible values into partitions that are meaningful for the program being tested. One value is selected for each partition. The objective is to partition the input space such that any value selected from the partition will affect the program under test in the same way as any other value in the partition. Thus, ideally if a test case contains a parameter \(x\) which has value \(y\), replacing \(y\) with any other value from the partition will not affect the test case result. This ideal may not always be achieved in practice.
直感的に明らかなこれら二つの方法はいずれも、取り得る値をテスト対象プログラムにとって意味のある区分に分割することで、テストの目的に十分と考えられる、より小さな値の集合を生成します。各区分から値を一つ選びます。目的は、ある区分から選んだどの値も、その区分内の他のどの値とも同じようにテスト対象プログラムに影響するように、入力空間を分割することです。したがって理想的には、テストケースに含まれるパラメーター\(x\)が値\(y\)を持つ場合、\(y\)を同じ区分の他のどの値に置き換えても、テストケースの結果は変わりません。この理想は、実際には常に達成されるとは限りません。
How should the partitions be determined? One obvious, but not necessarily good, approach is to simply select values from various points on the range of a variable. For example, if capacity can range from 0 to 20,000, it might seem sensible to select 0, 10,000, and 20,000 as possible values. But this approach is likely to miss important cases that depend on the specific requirements of the system under test. Some judgment is involved, but partitions are usually best determined from the specification. In this example, 9 am and 5 pm are significant, so 0540 (9 hours past midnight) and 1020 (17 hours past midnight) determine the appropriate partitions:
分割はどのように決定すべきか。明白ではあるが必ずしも良いとはいえない方法の一つは、変数の値域上のさまざまな点から単純に値を選ぶことです。例えば、容量が0から20,000の範囲をとりうる場合、0、10,000、20,000をとりうる値として選ぶのが妥当に思えるかもしれません。しかし、この方法では、テスト対象システムの具体的な要件に依存する重要なケースを見逃す可能性が高いです。ある程度の判断は必要ですが、分割は通常、仕様から決定するのが最善です。この例では午前9時と午後5時が重要であるため、0540(午前0時から9時間後)と1020(午前0時から17時間後)によって適切な分割が決まります。
Ideally, the program should behave the same for any of the times within the partitions; it should not matter whether the time is 4:00 am or 7:03 am, for example, because the specification treats both of these times the same. Similarly, it should not matter which time between the hours of 9 am and 5 pm is chose; the program should behave the same for 10:20 am and 2:33 pm. One common strategy, boundary value analysis, is to select test values at each boundary and at the smallest possible unit on either side of the boundary, for three values per boundary. The intuition, backed by empirical research, is that errors are more likely at boundary conditions because errors in programming may be made at these points. For example, if the requirements for automated teller machine software say that a withdrawal should not be allowed to exceed $300, a programming error such as the following could occur:
理想的には、プログラムは区分内のどの時刻でも同じように動作すべきです。例えば、仕様がこれらの時刻を同じように扱うため、午前 4:00 か午前 7:03 かは問題にならないはずです。同様に、午前 9 時から午後 5 時までの間のどの時刻を選んでも問題にならないはずであり、プログラムは午前 10:20 と午後 2:33 で同じように動作すべきです。一般的な戦略の一つである境界値分析では、各境界の値と、境界の両側にある可能な限り小さい単位の値をテスト値として選び、境界ごとに 3 つの値を用います。経験的研究に裏付けられた直観は、プログラミング上の誤りが境界点で生じることがあるため、境界条件で誤りが起こりやすいというものです。例えば、現金自動預け払い機ソフトウェアの要件で、300 ドルを超える引き出しは許可すべきではないと定められている場合、次のようなプログラミング上の誤りが起こりうます。
Use a maximum of 8 to 10 values per parameter to keep testing tractable.
テストの扱いやすさを保つため、パラメータごとに最大 8〜10 個の値を使用します。
if (amount > 0 && amount < 300) {
      //process withdrawal
} else {
      // error message
}Here, the second condition should have been “\(\mathtt{amount} \mathrel{<=} 300\)”, so a test case that includes the value \(\mathtt{amount} = 300\) can detect the error, but a test with \(\mathtt{amount} = 305\) would not.
ここで、二つ目の条件は「\(\mathtt{amount} \mathrel{<=} 300\)」であるべきだった。したがって、値\(\mathtt{amount} = 300\)を含むテストケースはこの誤りを検出できますが、\(\mathtt{amount} = 305\)のテストでは検出できません。
It is generally also desirable to test the extremes of ranges. One possible selection of values for the time parameter would then be: 0000, 0539, 0540, 0541, 1019, 1020, 1021, and 1440. More values would be better, but the tester may believe that this is the most effective set for the available time budget. With this selection, the total number of combinations is \(2 \cdot 8 \cdot 7 \cdot 2 \cdot 2 = 448\).
一般に、範囲の両端もテストすることが望ましい。その場合、時刻パラメーターの値の選び方の一例は、0000、0539、0540、0541、1019、1020、1021、1440となります。値は多い方がよいですが、テスターは、利用できる時間の範囲ではこれが最も効果的な集合だと判断することがあります。この選択では、組合せの総数は\(2 \cdot 8 \cdot 7 \cdot 2 \cdot 2 = 448\)です。
Generating covering arrays for \(t = 2\) through 6, as detailed in Section 3.1 results in the following number of tests:
3.1節で詳述するとおりに\(t = 2\)から6までの被覆配列を生成すると、テスト数は次のとおりとなります。
| t | # Tests |
|---|---|
| 2 | 56 |
| 3 | 112 |
| 4 | 224 |
| t | テスト数 |
|---|---|
| 2 | 56 |
| 3 | 112 |
| 4 | 224 |
Figure 11. Number of tests for access control example.
図 11. アクセス制御の例のテスト数。
4.2 Real-world Systems
4.2 実世界のシステム
As with the previous example, the advantage over exhaustive testing is not large, because of the small number of parameters. With larger problems, the advantages of combinatorial testing can be spectacular. For example, consider the problem of testing the software that processes switch settings for the panel shown in Figure 12. There are 34 switches, which can each be either on or off, for a total of \(2^{34}=1.7\times10^{10}\) possible settings. We clearly cannot test 17 billion possible settings, but all 3-way interactions can be tested with only 33 tests, and all 4-way interactions with only 85. This may seem surprising at first, but it results from the fact that every test of 34 parameters contains \(\binom{34}{3}\) = 5,984 3-way and \(\binom{34}{4}\) = 46,376 4-way combinations.
前の例と同様、パラメーター数が少ないため、全数テストに対する利点は大きくありません。より大きな問題では、組合せテストの利点は非常に大きくなり得ます。例えば、図12に示すパネルのスイッチ設定を処理するソフトウェアをテストする問題を考えます。スイッチは34個あり、それぞれオンかオフのどちらかなので、可能な設定の総数は\(2^{34}=1.7\times10^{10}\)となります。170億通りの設定をテストできないことは明らかですが、3-wayの相互作用はすべてわずか33件のテストで、4-wayの相互作用はすべてわずか85件でテストできます。これは一見意外に思えますが、34個のパラメーターの各テストが、\(\binom{34}{3}\) = 5,984個の3-wayの組合せと、\(\binom{34}{4}\) = 46,376個の4-wayの組合せを含むことによります。
The larger the system, the greater the benefit from combinatorial testing.
システムが大きいほど、組合せテストの利点も大きくなります。
PDF原本のp.27にある図 [装飾の画像。本文を読むのに必要のない装飾のため、この非公式サイトには掲載していません。原本 PDF を参照してください。]
Figure 12. Panel with 34 switches.
図 12. 34 個のスイッチを持つパネル。
4.3 Cost and Practical Considerations
4.3 コストと実務上の考慮事項
Combinatorial methods can be highly effective and reduce the cost of testing substantially. For example, Justin Hunter has applied these methods to a wide variety of test problems and consistently found both lower cost and more rapid error detection [30]. But as with most aspects of engineering, tradeoffs must be considered. Among the most important is the question of when to stop testing, balancing the cost of testing against the risk of failing to discover additional failures. An extensive body of research has been devoted to this topic, and sophisticated models are available for determining when the cost of further testing will exceed the expected benefits [10, 45]. Existing models for when to stop testing can be applied to the combinatorial test approach also, but there is an additional consideration: What is the appropriate interaction strength to use in this type of testing?
組合せ手法は非常に効果的で、テストのコストを大幅に削減できます。例えば、Justin Hunter はこれらの手法をさまざまなテスト問題に適用し、一貫して、より低いコストとより迅速な誤り検出の両方が得られることを確認しました [30]。しかし、工学の多くの側面と同様に、トレードオフを考慮しなければなりません。最も重要なものの一つは、テストをいつやめるかという問題であり、テストのコストと、追加の障害を発見できないリスクとのバランスをとることです。このテーマには広範な研究が行われており、追加のテストのコストが期待される利益を上回る時点を判断するための洗練されたモデルがあります [10, 45]。テストをいつやめるかに関する既存のモデルは組合せテストの手法にも適用できますが、さらに考慮すべき点があります。この種のテストで用いる適切な相互作用強度はどれか、という点です。
To address these questions consider the number of tests at different interaction strengths for an avionics software example [34] shown in Figure 13. While the number of tests will be different (probably much smaller than in Figure 13) depending on the system under test, the magnitude of difference between levels of \(t\) will be similar to Figure 13, because the number of tests grows with \(v^t\), for parameters with \(v\) values. That is, the number of tests grows with the exponent \(t\), so we want to use the smallest interaction strength that is appropriate for the problem. Intuitively, it seems that if no failures are detected by \(t\)-way tests, then it may be reasonable to conduct additional testing only for \(t+1\) interactions, but no greater if no additional failures are found at \(t+1\). In the empirical studies of software failures, the number of failures detected at \(t > 2\) decreased monotonically with \(t\), so this heuristic seems to make sense: start testing using 2-way (pairwise) combinations, continue increasing the interaction strength \(t\) until no errors are detected by the \(t\)-way tests, then (optionally) try \(t+1\) and ensure that no additional errors are detected. As with other aspects of software development, this guideline is also dependent on resources, time constraints, and cost-benefit considerations.
これらの問いに答えるため、図13に示す航空電子機器ソフトウェアの例[34]について、相互作用強度ごとのテスト数を考えます。テスト数はテスト対象システムによって異なる(おそらく図13よりかなり少ない)が、\(t\)の水準間の差の大きさは図13と同程度になります。テスト数は\(v^t\)に応じて増加するからです(各パラメーターの値は\(v\)個とする)。つまり、テスト数は指数\(t\)とともに増加するので、問題に適した最小の相互作用強度を使いました。直感的には、\(t\)-wayテストで障害が検出されなければ、追加のテストは\(t+1\)の相互作用についてだけ行い、\(t+1\)で新たな障害が見つからなければそれより上は行わない、というのが妥当と思われます。ソフトウェア障害の実証研究では、\(t > 2\)で検出される障害の数は\(t\)とともに単調に減少したので、次のヒューリスティックは理にかなっていると考えられます。2-way(ペアワイズ)の組合せでテストを始め、\(t\)-wayテストで誤りが検出されなくなるまで相互作用強度\(t\)を上げ続け、その後(任意で)\(t+1\)を試して、新たな誤りが検出されないことを確認します。ソフトウェア開発の他の側面と同様に、この指針も資源、時間的制約、費用対効果の考慮に左右されます。
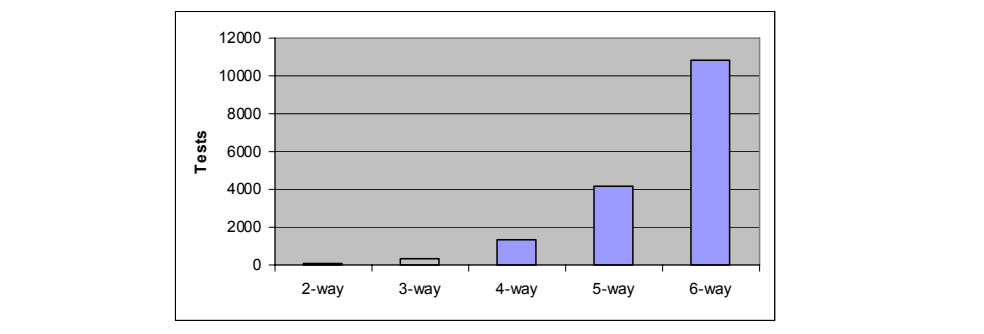
図13. アビオニクスの例におけるテスト数。枠で囲まれた棒グラフである。横軸は 2-way、3-way、4-way、5-way、6-way、縦軸「Tests」(テスト数)は0から12000まで2000刻みである。棒は相互作用の強度とともに急に高くなり、2-way は0をわずかに上回る程度、3-way は数百、4-way は1000をやや上回り、5-way は約4000、6-way は11000近くである。数値は記されていない。
Figure 13. Number of tests for avionics example.
図13. アビオニクスの例におけるテスト数
When applying combinatorial methods to input parameters, the key cost factors are the number of values per parameter, the interaction strength, and the number of parameters. As shown above, the number of tests increases rapidly as the value of t is increased, but the rate of increase depends on the number of values per parameter. Binary variables, with only two values each, result in far fewer tests than parameters with many values each. As a practical matter, when partitioning the input space (section 4.1), it is best to keep the number of values per parameter below 8 or 10 if possible.
入力パラメータに組合せ手法を適用する場合、主要なコスト要因は、パラメータあたりの値の数、相互作用の強度、およびパラメータの数です。上で示したように、テストの数はtの値が大きくなるにつれて急速に増加しますが、その増加率はパラメータあたりの値の数に依存します。値が2つしかない二値変数では、多くの値をとるパラメータに比べてテストの数がはるかに少なくなります。実際問題として、入力空間を分割する際(4.1節)には、可能であればパラメータあたりの値の数を8または10未満に抑えるのが最善です。
Because the number of tests increases only logarithmically with the number of parameters, test set size for a large problem may be only somewhat larger than for a much smaller problem. For example, if a project uses combinatorial testing for a system that has 20 parameters and generates several hundred tests, a much larger system with 40 to 50 parameters may only require a few dozen more tests. Combinatorial methods may generate the best cost benefit ratio for large systems.
テスト数はパラメーター数に対して対数的にしか増加しないため、大規模な問題のテスト集合の大きさは、はるかに小さな問題のものよりいくらか大きいだけで済むことがあります。例えば、あるプロジェクトが20個のパラメーターを持つシステムに組合せテストを適用して数百件のテストを生成する場合、40から50個のパラメーターを持つはるかに大きなシステムでも、必要なテストは数十件増えるだけかもしれません。組合せ手法は、大規模システムで最も良い費用便益比をもたらす可能性があります。
4.4 Chapter Summary
4.4 本章の要約
1.The key advantage of combinatorial testing derives from the fact that all, or nearly all, software failures appear to involve interactions of only a few parameters. Generating a covering array of input parameter values allows us to test all of these interactions, up to a level of 5-way or 6-way combinations, depending on resources.
1.組合せテストの主な利点は、ソフトウェア障害のすべて、またはほぼすべてが、ごく少数のパラメーター間の相互作用に関係しているように見えることから生じます。入力パラメーター値の被覆配列を生成すれば、資源に応じて5-wayまたは6-wayの組合せまで、これらすべての相互作用をテストできます。
•2. Practical testing often requires abstracting the possible values of a variable into a small set of equivalence classes. For example, if a variable is a 32-bit integer, it is clearly not possible to test the full range of values in +/- \(2^{31}\). This problem is not unique to combinatorial testing, but occurs in most test methodologies. Simple heuristics and engineering judgment are required to determine the appropriate portioning of values into equivalence classes, but once this is accomplished it is possible to generate covering arrays of a few hundred to a few thousand tests for many applications. The thoroughness of coverage will depend on resources and criticality of the application.
•2. 実践的なテストでは、多くの場合、変数がとりうる値を少数の同値クラスに抽象化する必要があります。例えば、変数が32ビット整数であれば、+/- \(2^{31}\)の値の全範囲をテストすることは明らかに不可能です。この問題は組合せテストに固有のものではなく、ほとんどのテスト方法論で生じます。値を同値クラスへ適切に分割するには、単純な経験則と工学的判断が必要ですが、それが済めば、多くのアプリケーションに対して数百から数千件のテストからなるカバリング配列を生成できます。網羅の徹底度は、リソースとアプリケーションの重要度に依存します。
5 SEQUENCE-COVERING ARRAYS
5 シーケンス被覆配列
In testing event-driven software, the critical condition for triggering failures often is whether or not a particular event has occurred prior to a second one, not necessarily if they are back to back. This situation reflects the fact that in many cases, a particular state must be reached before a particular failure can be triggered. For example, a failure might occur when connecting device A only if device B is already connected. The methods described in this chapter were developed to solve a real problem in interoperability test and evaluation, using combinatorial methods to provide efficient testing. Sequence covering arrays, as defined here, ensure that any t events will be tested in every possible t-way order.
イベント駆動型ソフトウェアのテストでは、障害を引き起こす重要な条件は、あるイベントが別のイベントより前に発生したかどうかであることが多く、それらが連続して発生するとは限りません。この状況は、多くの場合、特定の障害を引き起こす前に特定の状態に到達しなければならないという事実を反映しています。たとえば、機器Bがすでに接続されている場合にのみ、機器Aの接続時に障害が発生することがあります。本章で述べる手法は、組合せ手法を用いて効率的なテストを実現し、相互運用性のテストと評価における現実の問題を解決するために開発されました。ここで定義するシーケンス被覆配列は、任意のt個のイベントが、あらゆるt-wayの順序でテストされることを保証します。
For this problem we can define a sequence-covering array [39, 40], which is a set of tests that ensure all t-way sequences of events have been tested. The t events in the sequence may be interleaved with others, but all permutations will be tested. For example, we may have a component of a factory automation system that uses certain devices interacting with a control program. We want to test the events defined in Table 6.
この問題に対しては、シーケンス被覆配列 [39, 40] を定義できます。これは、すべてのt-wayのイベントシーケンスがテストされたことを保証するテストの集合です。シーケンス中のt個のイベントは他のイベントと入り交じっていてもよいですが、すべての順列がテストされます。たとえば、工場自動化システムのある構成要素が、制御プログラムと相互作用する特定の機器を使用しているとします。表6で定義されるイベントをテストしました。
In many systems, the order of inputs is important.
多くのシステムでは、入力の順序が重要です。
There are \(6! = 720\) possible sequences for these six events, and the system should respond correctly and safely no matter the order in which they occur. Operators may be instructed to use a particular order, but mistakes are inevitable, and should not result in injury to users or compromise the enterprise. Because setup, connections and operation of this component are manual, each test can take a considerable amount of time. It is not uncommon for system-level tests such as this to take hours to execute, monitor, and complete. We want to test this system as thoroughly as possible, but time and budget constraints do not allow for testing all possible sequences, so we will test all 3-event sequences.
これら六つのイベントには\(6! = 720\)通りのシーケンスがあり得ます。システムは、イベントがどの順序で発生しても、正しくかつ安全に応答すべきです。オペレーターは特定の順序を使うよう指示されることがありますが、誤りは避けられず、その誤りが利用者の負傷や組織への危害につながってはなりません。このコンポーネントのセットアップ、接続、操作は手作業であるため、テスト1件にかなりの時間がかかることがあります。このようなシステムレベルのテストでは、実行、監視、完了に数時間かかることも珍しくありません。このシステムをできる限り徹底的にテストしましたが、時間と予算の制約からすべてのシーケンスをテストすることはできないので、3イベントのシーケンスをすべてテストします。
With six events, \(a\), \(b\), \(c\), \(d\), \(e\), and \(f\), one subset of three is \(\{b, d, e\}\), which can be arranged in six permutations: \([b\ d\ e]\), \([b\ e\ d]\), \([d\ b\ e]\), \([d\ e\ b]\), \([e\ b\ d]\), \([e\ d\ b]\). A test that covers the permutation \([d\ b\ e]\) is: \([a\ d\ c\ f\ b\ e]\); another is \([a\ d\ c\ b\ e\ f]\). A larger example system may have 10 devices to connect, in which case the number of permutations is \(10!\), or 3,628,800 tests for exhaustive testing. In that case, a 3-way sequence covering array with 14 tests covering all \(10 \cdot 9 \cdot 8 = 720\) 3-way sequences is a dramatic improvement, as is 72 tests for all 4-way sequences (see Table 8).
六つのイベント\(a\)、\(b\)、\(c\)、\(d\)、\(e\)、\(f\)がある場合、三つからなる部分集合の一つは\(\{b, d, e\}\)であり、これは六通りの順列に並べられます。すなわち\([b\ d\ e]\)、\([b\ e\ d]\)、\([d\ b\ e]\)、\([d\ e\ b]\)、\([e\ b\ d]\)、\([e\ d\ b]\)です。順列\([d\ b\ e]\)を網羅するテストの一つは\([a\ d\ c\ f\ b\ e]\)であり、もう一つは\([a\ d\ c\ b\ e\ f]\)です。より大きなシステムの例では、接続するデバイスが10台あることがあり、その場合の順列の数は\(10!\)、すなわち全数テストでは3,628,800件のテストとなります。この場合、\(10 \cdot 9 \cdot 8 = 720\)通りの3-wayシーケンスすべてを14件のテストで網羅する3-wayシーケンス被覆配列は、劇的な改善です。すべての4-wayシーケンスを72件のテストで網羅できることも同様です(表8を参照)。
| Event | Description |
|---|---|
| a | connect air flow meter |
| b | connect pressure gauge |
| c | connect satellite link |
| d | connect pressure readout |
| e | engage drive motor |
| f | engage steering control |
| イベント | 説明 |
|---|---|
| a | 気流計を接続する |
| b | 圧力計を接続する |
| c | 衛星回線を接続する |
| d | 圧力表示器を接続する |
| e | 駆動モーターを作動させる |
| f | 操舵制御を作動させる |
Table 6. System events
表6. システムイベント
Definition. We define a sequence covering array, SCA(N, S, t) as an N x S matrix where entries are from a finite set S of s symbols, such that every t-way permutation of symbols from S occurs in at least one row; the t symbols in the permutation are not required to be adjacent. That is, for every t-way arrangement of symbols \(x_1, x_2, ..., x_t\), the regular expression \(.*x_1.*x_2.*x_t.*\) matches at least one row in the array. Sequence covering arrays, as the name implies, are analogous to standard covering arrays, which include at least one of every t-way combination of any n variables, where t<n. A variety of algorithms are available for constructing covering arrays, but these are not usable for generating t-way sequences because they are designed to cover combinations in any order.
定義。シーケンスカバリング配列SCA(N, S, t)を、N x Sの行列であって、その要素がs個の記号からなる有限集合Sから取られ、Sの記号のあらゆるt-way順列が少なくとも1つの行に現れるものと定義します。ただし、順列中のt個の記号は隣接している必要はありません。すなわち、記号のあらゆるt-wayの並び\(x_1, x_2, ..., x_t\)について、正規表現\(.*x_1.*x_2.*x_t.*\)が配列中の少なくとも1つの行に一致します。シーケンスカバリング配列は、その名が示すとおり、標準的なカバリング配列に類似しています。標準的なカバリング配列は、任意のn個の変数のあらゆるt-way組合せ(t<n)を少なくとも1つずつ含みます。カバリング配列を構築するためのさまざまなアルゴリズムが利用可能ですが、それらは任意の順序で組合せを網羅するよう設計されているため、t-wayシーケンスの生成には使用できません。
Example 1. Consider the problem of testing four events, a, b, c, and d. For convenience, a t-way permutation of symbols is referred to as a t-way sequence. There are 4! = 24 possible permutations of these four events, but we can test all 3-way sequences of these events with only six tests (see Table 7).
例1. 4つのイベントa、b、c、dをテストする問題を考えます。便宜上、記号のt-way順列をt-wayシーケンスと呼びます。これら4つのイベントの順列は4! = 24通りありますが、わずか6件のテストでこれらのイベントのすべての3-wayシーケンスをテストできます(表7を参照してください)。
| Test | ||||
|---|---|---|---|---|
| 1 | a | d | b | c |
| 2 | b | a | c | d |
| 3 | b | d | c | a |
| 4 | c | a | b | d |
| 5 | c | d | b | a |
| 6 | d | a | c | b |
| テスト | ||||
|---|---|---|---|---|
| 1 | a | d | b | c |
| 2 | b | a | c | d |
| 3 | b | d | c | a |
| 4 | c | a | b | d |
| 5 | c | d | b | a |
| 6 | d | a | c | b |
Table 7. Tests for four events.
表7. 四つのイベントに対するテスト。
5.1 Constructing Sequence Covering Arrays
5.1 シーケンスカバリング配列の構築
A 2-way sequence covering array can be constructed by listing the events in some order for one test and in reverse order for the second test:
2-wayシーケンス被覆配列は、一つ目のテストでイベントをある順序で並べ、二つ目のテストでその逆順に並べることで構築できます。
| 1 | a | b | c | d |
|---|---|---|---|---|
| 2 | d | c | b | a |
| 1 | a | b | c | d |
|---|---|---|---|---|
| 2 | d | c | b | a |
To see that the procedure in Example 2 generates tests that cover all 2-way sequences, note that for 2-way sequence coverage, every pair of variables x and y, x..y and y..x must both be in some test (where a..b means that a is eventually followed by b). All variables are included in each test, therefore any sequence x..y must be in either test 1 or test 2 and its reverse y..x in the other test.
例2の手順で、すべての2-wayシーケンスを網羅するテストが生成されることを確認するには、2-wayシーケンスの網羅では、変数のすべてのペアxとyについて、x..yとy..xの両方が、いずれかのテストに含まれなければならない点に注目します(a..bは、aの後に最終的にbが続くことを意味します)。すべての変数が各テストに含まれるため、任意のシーケンスx..yはテスト1またはテスト2のいずれかに含まれ、その逆のy..xはもう一方のテストに含まれます。
For \(t\)-way sequence test generation, where \(\mathrm{t} > 2\), we use a greedy algorithm that generates a large number of tests, scores each by the number of previously uncovered sequences it covers, then chooses the highest scoring test. This simple approach produces surprisingly good results,
\(t\)-wayシーケンスのテスト生成(\(\mathrm{t} > 2\)の場合)には、多数のテストを生成し、それぞれが網羅する未網羅のシーケンスの数で点数を付け、最も点数の高いテストを選ぶ貪欲アルゴリズムを使います。この単純な方法は驚くほど良い結果をもたらし、
5.2 Using Sequence Covering Arrays
5.2 シーケンス被覆配列の使用
Sequence covering arrays have been incorporated into operational testing for a mission-critical system that uses multiple devices with inputs and outputs to a laptop computer. The test procedure has 8 steps: boot system, open application, run scan, connect peripherals P-1 through P-5. It is expected that for some sequences, the system will not function properly, thus the order of connecting peripherals is a critical aspect of testing. In addition, there are constraints on the sequence of events: can't scan until the app is open; can't open app until system is booted. There are 40,320 permutations of 8 steps, but some are redundant (e.g., changing the order of peripherals connected before boot), and some are invalid (violates a constraint). Around 7,000 are valid, and non-redundant, but this is far too many to test for a system that requires manual, physical connections of devices.
シーケンスカバリング配列は、ラップトップコンピュータとの間で入出力を行う複数のデバイスを使用するミッションクリティカルなシステムの運用テストに組み込まれています。テスト手順は8ステップからなります。すなわち、システムの起動、アプリケーションの起動、スキャンの実行、周辺機器P-1〜P-5の接続です。一部のシーケンスではシステムが正しく機能しないと予想されるため、周辺機器を接続する順序はテストの重要な観点となります。さらに、イベントの順序には制約があります。アプリケーションが開かれるまではスキャンできず、システムが起動するまではアプリケーションを開けません。8ステップの順列は40,320通りありますが、その一部は冗長であり(例:起動前に接続する周辺機器の順序を入れ替えるもの)、一部は無効です(制約に違反するもの)。有効かつ冗長でないものはおよそ7,000通りですが、デバイスを手作業で物理的に接続する必要のあるシステムでテストするには多すぎます。
The system was tested using a seven-step sequence covering array, incorporating the assumption that there is no need to examine strength-3 sequences that involve boot-up. The initial test configuration (Figure 14) was drawn from the library of pre-computed sequence tests. Some changes were made to the pre-computed sequences based on unique requirements of the system test. If 6='Open App' and 5='Run Scan', then cases 1, 4, 6, 8, 10, and 12 are invalid, because the scan cannot be run before the application is started. This was handled by 'swapping 0 and 1' when they are adjacent (1 and 4), out of order. For the other cases, several cases were generated from each that were valid mutations of the invalid case. A test was also embedded to see whether it mattered where each of three USB connections were placed. The last test case ensures at least strength 2 (sequence of length 2) for all peripheral connections and 'Boot', i.e., that each peripheral connection occurs prior to boot. The final test array is shown in Table 9.
システムは、起動を含む強度3のシーケンスを調べる必要はないという前提を取り入れた、7ステップのシーケンス被覆配列を用いてテストされました。初期のテスト構成(図14)は、事前計算済みのシーケンステストのライブラリから取得しました。システムテスト固有の要件に基づき、事前計算済みのシーケンスにいくつかの変更を加えました。6='Open App'かつ5='Run Scan'とすると、アプリケーションを起動する前にスキャンを実行することはできないため、ケース1、4、6、8、10、12は無効です。これについては、両者が隣接して順序が逆になっている場合(ケース1と4)、「0と1を入れ替える」ことで対処しました。その他のケースについては、無効なケースを有効な形に変異させたケースを、それぞれから複数生成しました。また、三つのUSB接続のそれぞれをどこに配置するかが影響するかどうかを調べるテストも組み込みました。最後のテストケースは、すべての周辺機器接続と'Boot'について少なくとも強度2(長さ2のシーケンス)を保証します。すなわち、各周辺機器の接続が起動より前に行われる場合を保証します。最終的なテスト配列を表9に示します。
| Test 1 | 0 | 1 | 2 | 3 | 4 | 5 | 6 |
|---|---|---|---|---|---|---|---|
| Test 2 | 6 | 5 | 4 | 3 | 2 | 1 | 0 |
| Test 3 | 2 | 1 | 0 | 6 | 5 | 4 | 3 |
| Test 4 | 3 | 4 | 5 | 6 | 0 | 1 | 2 |
| Test 5 | 4 | 1 | 6 | 0 | 3 | 2 | 5 |
| Test 6 | 5 | 2 | 3 | 0 | 6 | 1 | 4 |
| Test 7 | 0 | 6 | 4 | 5 | 2 | 1 | 3 |
| Test 8 | 3 | 1 | 2 | 5 | 4 | 6 | 0 |
| Test 9 | 6 | 2 | 5 | 0 | 3 | 4 | 1 |
| Test 10 | 1 | 4 | 3 | 0 | 5 | 2 | 6 |
| Test 11 | 2 | 0 | 3 | 4 | 6 | 1 | 5 |
| Test 12 | 5 | 1 | 6 | 4 | 3 | 0 | 2 |
| テスト 1 | 0 | 1 | 2 | 3 | 4 | 5 | 6 |
|---|---|---|---|---|---|---|---|
| テスト 2 | 6 | 5 | 4 | 3 | 2 | 1 | 0 |
| テスト 3 | 2 | 1 | 0 | 6 | 5 | 4 | 3 |
| テスト 4 | 3 | 4 | 5 | 6 | 0 | 1 | 2 |
| テスト 5 | 4 | 1 | 6 | 0 | 3 | 2 | 5 |
| テスト 6 | 5 | 2 | 3 | 0 | 6 | 1 | 4 |
| テスト 7 | 0 | 6 | 4 | 5 | 2 | 1 | 3 |
| テスト 8 | 3 | 1 | 2 | 5 | 4 | 6 | 0 |
| テスト 9 | 6 | 2 | 5 | 0 | 3 | 4 | 1 |
| テスト 10 | 1 | 4 | 3 | 0 | 5 | 2 | 6 |
| テスト 11 | 2 | 0 | 3 | 4 | 6 | 1 | 5 |
| テスト 12 | 5 | 1 | 6 | 4 | 3 | 0 | 2 |
Figure 14. Sevenevent test from precomputed test library.
図14. 事前計算済みテストライブラリから得た七イベントテスト。
5.3 Cost and Practical Considerations
5.3 コストと実務上の考慮事項
As with other forms of combinatorial testing, some combinations may be either impossible or not exist on the system under test. For example, ‘receive message’ must occur before ‘process message’. The algorithm we have developed makes it possible to specify pairs x,y, where the sequence x..y is to be excluded from the generated covering array. Typically this will lead to extra tests, but does not increase the test array significantly.
他の形式の組合せテストと同様に、組合せの中には実現不可能なものや、テスト対象システムに存在しないものがあります。例えば、「メッセージの処理」より先に「メッセージの受信」が起きなければなりません。開発したアルゴリズムでは、シーケンスx..yを生成される被覆配列から除外するよう、ペアx、yを指定できます。通常、これは余分なテストを生みますが、テスト配列を大幅に増大させるものではありません。
5.4 Chapter Summary
5.4 本章の要約
1.Sequence covering arrays are a new application of combinatorial methods, developed by NIST to solve problems with interoperability testing. A sequence-covering array is a set of tests that ensure all t-way sequences of events have been tested. The t events in the sequence may be interleaved with others, but all permutations will be tested.
1.シーケンス被覆配列は、相互運用性テストの問題を解決するためにNISTが開発した、組合せ手法の新たな応用です。シーケンス被覆配列は、すべてのt-wayイベントシーケンスがテストされることを保証するテスト集合です。シーケンス中のt個のイベントの間に他のイベントが入ってもよいですが、すべての順列がテストされます。
2.All 2-way sequences can be tested simply by listing the events to be tested in any order, then reversing the order to create a second test. Algorithms have been developed to create sequence covering arrays for higher strength interaction levels.
2.すべての2-wayシーケンスは、テスト対象のイベントを任意の順序で並べ、次にその順序を逆にして二つ目のテストを作成するだけでテストできます。より高い相互作用強度のシーケンス被覆配列を作成するアルゴリズムも開発されています。
3.As with other types of combinatorial testing, constraints may be important, since it is very common that certain events depend on others occurring first. The tools NIST has developed for this problem allow the user to specify constraints in the form of excluded sequences which will not appear in the generated test array.
3.他の種類の組合せテストと同様、制約が重要な場合があります。イベントの中には、他のイベントが先に発生することを必要とするものが非常に多いためです。NISTがこの問題向けに開発したツールでは、生成されるテスト配列に含めないシーケンスとして制約を指定できます。
| Events | 3-seq Tests | 4-seq Tests |
|---|---|---|
| 5 | 8 | 29 |
| 6 | 10 | 38 |
| 7 | 12 | 50 |
| 8 | 12 | 56 |
| 9 | 14 | 68 |
| 10 | 14 | 72 |
| 11 | 14 | 78 |
| 12 | 16 | 86 |
| 13 | 16 | 92 |
| 14 | 16 | 100 |
| 15 | 18 | 108 |
| 16 | 18 | 112 |
| 17 | 20 | 118 |
| 18 | 20 | 122 |
| 19 | 22 | 128 |
| 20 | 22 | 134 |
| 21 | 22 | 134 |
| 22 | 22 | 140 |
| 23 | 24 | 146 |
| 24 | 24 | 146 |
| 25 | 24 | 152 |
| 26 | 24 | 158 |
| 27 | 26 | 160 |
| 28 | 26 | 162 |
| 29 | 26 | 166 |
| 30 | 26 | 166 |
| 40 | 32 | 198 |
| 50 | 34 | 214 |
| 60 | 38 | 238 |
| 70 | 40 | 250 |
| 80 | 42 | 264 |
| 90 | 44 | |
| 100 | 44 |
| イベント数 | 3-seqテスト | 4-seqテスト |
|---|---|---|
| 5 | 8 | 29 |
| 6 | 10 | 38 |
| 7 | 12 | 50 |
| 8 | 12 | 56 |
| 9 | 14 | 68 |
| 10 | 14 | 72 |
| 11 | 14 | 78 |
| 12 | 16 | 86 |
| 13 | 16 | 92 |
| 14 | 16 | 100 |
| 15 | 18 | 108 |
| 16 | 18 | 112 |
| 17 | 20 | 118 |
| 18 | 20 | 122 |
| 19 | 22 | 128 |
| 20 | 22 | 134 |
| 21 | 22 | 134 |
| 22 | 22 | 140 |
| 23 | 24 | 146 |
| 24 | 24 | 146 |
| 25 | 24 | 152 |
| 26 | 24 | 158 |
| 27 | 26 | 160 |
| 28 | 26 | 162 |
| 29 | 26 | 166 |
| 30 | 26 | 166 |
| 40 | 32 | 198 |
| 50 | 34 | 214 |
| 60 | 38 | 238 |
| 70 | 40 | 250 |
| 80 | 42 | 264 |
| 90 | 44 | |
| 100 | 44 |
Table 8. Number of tests for combinatorial 3way and 4way sequences.
表8. 組合せ3-wayおよび4-wayシーケンスのテスト数。
Table 9. Final sequence covering array used in testing.
表9. テストに使用した最終シーケンス被覆配列。
| Original Case | Case | Step1 | Step2 | Step3 | Step4 | Step5 | Step6 | Step7 | Step8 |
|---|---|---|---|---|---|---|---|---|---|
| 1 | 1 | Boot | P-1 (USB-RIGHT) | P-2 (USB-BACK) | P-3 (USB-LEFT) | P-4 | P-5 | Application | Scan |
| 2 | 2 | Boot | Application | Scan | P-5 | P-4 | P-3 (USB-RIGHT) | P-2 (USB-BACK) | P-1 (USB-LEFT) |
| 3 | 3 | Boot | P-3 (USB-RIGHT) | P-2 (USB-LEFT) | P-1 (USB-BACK) | Application | Scan | P-5 | P-4 |
| 4 | 4 | Boot | P-4 | P-5 | Application | Scan | P-1 (USB-RIGHT) | P-2 (USB-LEFT) | P-3 (USB-BACK) |
| 5 | 5 | Boot | P-5 | P-2 (USB-RIGHT) | Application | P-1 (USB-BACK) | P-4 | P-3 (USB-LEFT) | Scan |
| 6A | 6 | Boot | Application | P-3 (USB-BACK) | P-4 | P-1 (USB-LEFT) | Scan | P-2 (USB-RIGHT) | P-5 |
| 6B | 7 | Boot | Application | Scan | P-3 (USB-LEFT) | P-4 | P-1 (USB-RIGHT) | P-2 (USB-BACK) | P-5 |
| 6C | 8 | Boot | P-3 (USB-RIGHT) | P-4 | P-1 (USB-LEFT) | Application | Scan | P-2 (USB-BACK) | P-5 |
| 6D | 9 | Boot | P-3 (USB-RIGHT) | Application | P-4 | Scan | P-1 (USB-BACK) | P-2 (USB-LEFT) | P-5 |
| 7 | 10 | Boot | P-1 (USB-RIGHT) | Application | P-5 | Scan | P-3 (USB-BACK) | P-2 (USB-LEFT) | P-4 |
| 8A | 11 | Boot | P-4 | P-2 (USB-RIGHT) | P-3 (USB-LEFT) | Application | Scan | P-5 | P-1 (USB-BACK) |
| 8B | 12 | Boot | P-4 | P-2 (USB-RIGHT) | P-3 (USB-BACK) | P-5 | Application | Scan | P-1 (USB-LEFT) |
| 9 | 13 | Boot | Application | P-3 (USB-LEFT) | Scan | P-1 (USB-RIGHT) | P-4 | P-5 | P-2 (USB-BACK) |
| 10A | 14 | Boot | P-2 (USB-BACK) | P-5 | P-4 | P-1 (USB-LEFT) | P-3 (USB-RIGHT) | Application | Scan |
| 10B | 15 | Boot | P-2 (USB-LEFT) | P-5 | P-4 | P-1 (USB-BACK) | Application | Scan | P-3 (USB-RIGHT) |
| 11 | 16 | Boot | P-3 (USB-BACK) | P-1 (USB-RIGHT) | P-4 | P-5 | Application | P-2 (USB-LEFT) | Scan |
| 12A | 17 | Boot | Application | Scan | P-2 (USB-RIGHT) | P-5 | P-4 | P-1 (USB-BACK) | P-3 (USB-LEFT) |
| 12B | 18 | Boot | P-2 (USB-RIGHT) | Application | Scan | P-5 | P-4 | P-1 (USB-LEFT) | P-3 (USB-BACK) |
| NA | 19 | P-5 | P-4 | P-3 (USB-LEFT) | P-2 (USB-RIGHT) | P-1 (USB-BACK) | Boot | Application | Scan |
| 元のケース | ケース | ステップ1 | ステップ2 | ステップ3 | ステップ4 | ステップ5 | ステップ6 | ステップ7 | ステップ8 |
|---|---|---|---|---|---|---|---|---|---|
| 1 | 1 | ブート | P-1 (USB-RIGHT) | P-2 (USB-BACK) | P-3 (USB-LEFT) | P-4 | P-5 | アプリケーション | スキャン |
| 2 | 2 | ブート | アプリケーション | スキャン | P-5 | P-4 | P-3 (USB-RIGHT) | P-2 (USB-BACK) | P-1 (USB-LEFT) |
| 3 | 3 | ブート | P-3 (USB-RIGHT) | P-2 (USB-LEFT) | P-1 (USB-BACK) | アプリケーション | スキャン | P-5 | P-4 |
| 4 | 4 | ブート | P-4 | P-5 | アプリケーション | スキャン | P-1 (USB-RIGHT) | P-2 (USB-LEFT) | P-3 (USB-BACK) |
| 5 | 5 | ブート | P-5 | P-2 (USB-RIGHT) | アプリケーション | P-1 (USB-BACK) | P-4 | P-3 (USB-LEFT) | スキャン |
| 6A | 6 | ブート | アプリケーション | P-3 (USB-BACK) | P-4 | P-1 (USB-LEFT) | スキャン | P-2 (USB-RIGHT) | P-5 |
| 6B | 7 | ブート | アプリケーション | スキャン | P-3 (USB-LEFT) | P-4 | P-1 (USB-RIGHT) | P-2 (USB-BACK) | P-5 |
| 6C | 8 | ブート | P-3 (USB-RIGHT) | P-4 | P-1 (USB-LEFT) | アプリケーション | スキャン | P-2 (USB-BACK) | P-5 |
| 6D | 9 | ブート | P-3 (USB-RIGHT) | アプリケーション | P-4 | スキャン | P-1 (USB-BACK) | P-2 (USB-LEFT) | P-5 |
| 7 | 10 | ブート | P-1 (USB-RIGHT) | アプリケーション | P-5 | スキャン | P-3 (USB-BACK) | P-2 (USB-LEFT) | P-4 |
| 8A | 11 | ブート | P-4 | P-2 (USB-RIGHT) | P-3 (USB-LEFT) | アプリケーション | スキャン | P-5 | P-1 (USB-BACK) |
| 8B | 12 | ブート | P-4 | P-2 (USB-RIGHT) | P-3 (USB-BACK) | P-5 | アプリケーション | スキャン | P-1 (USB-LEFT) |
| 9 | 13 | ブート | アプリケーション | P-3 (USB-LEFT) | スキャン | P-1 (USB-RIGHT) | P-4 | P-5 | P-2 (USB-BACK) |
| 10A | 14 | ブート | P-2 (USB-BACK) | P-5 | P-4 | P-1 (USB-LEFT) | P-3 (USB-RIGHT) | アプリケーション | スキャン |
| 10B | 15 | ブート | P-2 (USB-LEFT) | P-5 | P-4 | P-1 (USB-BACK) | アプリケーション | スキャン | P-3 (USB-RIGHT) |
| 11 | 16 | ブート | P-3 (USB-BACK) | P-1 (USB-RIGHT) | P-4 | P-5 | アプリケーション | P-2 (USB-LEFT) | スキャン |
| 12A | 17 | ブート | アプリケーション | スキャン | P-2 (USB-RIGHT) | P-5 | P-4 | P-1 (USB-BACK) | P-3 (USB-LEFT) |
| 12B | 18 | ブート | P-2 (USB-RIGHT) | アプリケーション | スキャン | P-5 | P-4 | P-1 (USB-LEFT) | P-3 (USB-BACK) |
| NA | 19 | P-5 | P-4 | P-3 (USB-LEFT) | P-2 (USB-RIGHT) | P-1 (USB-BACK) | ブート | アプリケーション | スキャン |
6 MEASURING COMBINATORIAL COVERAGE
6 組合せカバレッジの測定
Since it is nearly always impossible to test all possible combinations, combinatorial testing is a reasonable alternative. For some value of t, testing all t-way interactions among n parameters will detect nearly all errors. It is possible that t = n, but recalling the empirical data on failures, we would expect t to be relatively small. Determining the level of input or configuration state space coverage can help in understanding the degree of risk that remains after testing. If 90% - 100% of the state space has been covered, then presumably the risk is small, but if coverage is much smaller, then the risk may be substantial. This chapter describes some measures of combinatorial coverage that can be helpful in estimating this risk that we have applied to tests for spacecraft software [50] but have general application to any combinatorial coverage problem.
考えられるすべての組合せをテストすることはほぼ常に不可能であるため、組合せテストは合理的な代替手段となります。ある t の値に対して、n 個のパラメータ間のすべての t 項相互作用をテストすれば、ほぼすべてのエラーを検出できます。t = n となる可能性もありますが、障害に関する実証データを思い起こせば、t は比較的小さいと予想されます。入力または構成の状態空間のカバレッジの水準を把握することは、テスト後に残るリスクの程度を理解する助けとなります。状態空間の90%〜100%がカバーされていれば、おそらくリスクは小さいですが、カバレッジがはるかに小さければ、リスクは相当大きい可能性があります。本章では、このリスクの推定に役立つ組合せカバレッジの尺度をいくつか説明します。これらの尺度は宇宙機ソフトウェアのテストに適用したものであるが [50]、組合せカバレッジのあらゆる問題に一般に適用できます。
6.1 Software Test Coverage
6.1 ソフトウェアテストの網羅率
Test coverage is one of the most important topics in software assurance. Users would like some quantitative measure to judge the risk in using a product. For a given test set, what can we say about the combinatorial coverage it provides? With physical products, such as light bulbs or motors, reliability engineers can provide a probability of failure within a particular time frame. This is possible because the failures in physical products are typically the result of natural processes, such as metal fatigue.
テストカバレッジは、ソフトウェア保証において最も重要なトピックの一つです。利用者は、製品を使用する際のリスクを判断するための何らかの定量的な尺度を求めます。あるテストセットについて、それが提供する組合せカバレッジについて何が言えるだろうか。電球やモーターのような物理的な製品であれば、信頼性エンジニアは特定の期間内に障害が発生する確率を示すことができます。これが可能なのは、物理的な製品の障害が、通常、金属疲労のような自然の過程の結果だからです。
With software the situation is more complex, and many different approaches have been devised for determining software test coverage. With millions of lines of code, or only with a few thousand, the number of paths through a program is so large that it is impossible to test all paths. For each if statement, there are two possible branches, so a sequence of \(n\) if statements will result in \(2^n\) possible paths. Thus even a small program with only 270 if statements in an execution trace may have more possible paths than there are atoms in the universe, which is on the order of \(10^{80}\). With loops (while statements) the number of possible paths is literally infinite. Thus a variety of measures have been developed to gauge the degree of test coverage. The following are some of the better-known coverage metrics:
ソフトウェアでは状況はより複雑であり、ソフトウェアのテストカバレッジを判定するためにさまざまな手法が考案されてきました。コードが数百万行であっても数千行にすぎなくても、プログラム内の経路の数は非常に大きいため、すべての経路をテストすることは不可能です。if 文ごとに2つの分岐がありうるため、\(n\) 個の if 文が連なると \(2^n\) 通りの経路が生じます。したがって、実行トレース中の if 文が270個しかない小さなプログラムでも、宇宙に存在する原子の数(\(10^{80}\) のオーダー)より多くの経路を持ちうます。ループ(while 文)があると、可能な経路の数は文字どおり無限になります。そのため、テストカバレッジの程度を測るさまざまな尺度が開発されてきました。よく知られたカバレッジ指標には次のものがあります。
Commonly used coverage measures do not apply well to combinatorial testing.
一般的に使用されるカバレッジ尺度は、組合せテストにはうまく当てはまりません。
•Statement coverage: This is the simplest of coverage criteria – the percentage of statements exercised by the test set. While it may seem at first that 100% statement coverage should provide good confidence in the program, in practice, statement coverage is a relatively weak criterion. At best, statement coverage represents a sanity check: unless statement coverage is close to 100%, the test set is probably inadequate.
•ステートメント網羅率:最も単純な網羅基準であり、テストセットによって実行されたステートメントの割合を表します。ステートメント網羅率が100%であればプログラムに対する高い信頼が得られるように思えますが、実際には比較的弱い基準です。せいぜい健全性の確認を示すにすぎず、ステートメント網羅率が100%に近くなければ、テストセットはおそらく不十分です。
•Decision or branch coverage: The percentage of branches that have been evaluated to both true and false by the test set.
•判定網羅率または分岐網羅率:テストセットにより真と偽の両方に評価された分岐の割合。
•Condition coverage: The percentage of conditions within decision expressions that have been evaluated to both true and false. Note that 100% condition coverage does not guarantee 100% decision coverage. For example, “if (A || B) {do something} else {do something else}” is tested with [0 1], [1 0], then A and B will both have been evaluated to 0 and 1, but the else branch will not be taken because neither test leaves both A and B false.
•条件網羅率:判定式内の条件が、真と偽の両方に評価された割合。条件網羅率が100%でも、判定網羅率が100%になるとは限らない点に注意されました。例えば、“if (A || B) {do something} else {do something else}”を[0 1]と[1 0]でテストすると、AとBはどちらも0と1に評価されていますが、どちらのテストでもAとBが両方とも偽にはならないため、else分岐は実行されません。
•Modified condition decision coverage (MCDC): This is a strong coverage criterion that is required by the US Federal Aviation Administration for Level A (catastrophic failure consequence) software; i.e., software whose failure could lead to complete loss of life. It requires that every condition in a decision in the program has taken on all possible outcomes at least once, and each condition has been shown to independently affect the decision outcome, and that each entry and exit point have been invoked at least once.
•修正条件/判定網羅率(MCDC):米国連邦航空局(FAA)が、レベルA(壊滅的な故障結果)に該当するソフトウェア、すなわち故障により人命が完全に失われる可能性のあるソフトウェアに要求する、強力な網羅基準です。プログラム内の判定に含まれるすべての条件が、少なくとも一度は取り得るすべての結果となること、各条件が判定結果に独立して影響することが示されること、さらに各入口点および出口点が少なくとも一度呼び出されることを要求します。
6.2 Combinatorial Coverage
6.2 組合せ網羅率
Note that the coverage measures above depend on access to program source code. Combinatorial testing, in contrast, is a black box technique. Inputs are specified and expected results determined from some form of specification. The program is then treated as simply a processor that accepts inputs and produces outputs, with no knowledge expected of its inner workings.
上記の網羅率尺度は、プログラムのソースコードを利用できることに依存する点に注意されました。これに対し、組合せテストはブラックボックス技法です。入力を指定し、何らかの形式の仕様から期待結果を決定します。そのうえでプログラムは、入力を受け取り出力を生成する単なる処理装置として扱われ、内部の動作についての知識は前提としません。
Even in the absence of knowledge about a program’s inner structure, we can apply combinatorial methods to produce precise and useful measures. In this case, we measure the state space of inputs. Suppose we have a program that accepts two inputs, \(x\) and \(y\), with 10 values each. Then the input state space consists of the \(10^2 = 100\) pairs of \(x\) and \(y\) values, which can be pictured as a checkerboard square of 10 rows by 10 columns. With three inputs, \(x\), \(y\), and \(z\), we would have a cube with \(10^3 = 1{,}000\) points in its input state space. Extending the example to n inputs we would have a (hard to visualize) hypercube of \(n\) dimensions with \(10^n\) points. Exhaustive testing would require inputs of all \(10^n\) combinations, but combinatorial testing could be used to reduce the size of the test set.
プログラムの内部構造を知らなくても、組合せ手法を適用して正確で有用な指標を得ることができます。この場合、入力の状態空間を測定します。10個ずつの値を受け付ける二つの入力\(x\)、\(y\)を持つプログラムを考えます。この場合、入力状態空間は\(10^2 = 100\)個の\(x\)と\(y\)の値の組から成り、10行10列のチェッカーボード状の正方形として表せます。三つの入力\(x\)、\(y\)、\(z\)の場合、入力状態空間は\(10^3 = 1{,}000\)個の点から成る立方体となります。この例をn個の入力に拡張すると、\(n\)次元の(可視化が難しい)超立方体となり、その点は\(10^n\)個です。網羅的テストでは\(10^n\)通りすべての組合せを入力する必要がありますが、組合せテストを使えばテストセットの規模を削減できます。
How should state space coverage be measured? Looking closely at the nature of combinatorial testing leads to several measures that are useful. We begin by introducing what will be called a variable-value configuration.
状態空間の網羅率はどのように測定すべきだろうか。組合せテストの性質を詳しく見ると、有用な尺度がいくつか得られます。まず、変数値構成と呼ぶものを導入します。
Definition. For a set of t variables, a variable-value configuration is a set of t valid values, one for each of the variables.
定義。t個の変数の集合に対し、変数値構成とは、各変数に一つずつ対応する、t個の有効な値の集合です。
Example. Given four binary variables, a, b, c, and d, a=0, c=1, d=0 is a variable-value configuration, and a=1, c=1, d=0 is a different variable-value configuration for the same three variables a, c, and d.
例。二値変数a、b、c、dが四つあるとします。a=0、c=1、d=0は変数値構成であり、a、c、dという同じ三変数に対する別の変数値構成はa=1、c=1、d=0です。
6.2.1 Simple t -way combination coverage
6.2.1 単純なt-way組合せ網羅率
Of the total number of t-way combinations for a given collection of variables, what percentage will be covered by the test set? If the test set is a covering array, then coverage is 100%, by definition, but many test sets not based on covering arrays may still provide significant t-way coverage. If the test set is large, but not designed as a covering array, it is very possible that it provides 2-way coverage or better. For example, random input generation may have been used to produce the tests, and good branch or condition coverage may have been achieved. In addition to the structural coverage figure, for software assurance it would be helpful to know what percentage of 2-way, 3-way, etc. coverage has been obtained.
ある変数の集合に対する t 項組合せの総数のうち、テストセットによって何パーセントがカバーされるだろうか。テストセットがカバリング配列であれば、定義上カバレッジは100%ですが、カバリング配列に基づかない多くのテストセットも、相当の t 項カバレッジを提供することがあります。テストセットが大きければ、カバリング配列として設計されていなくても、2項以上のカバレッジを提供している可能性は十分にあります。たとえば、テストの作成にランダムな入力生成が使用され、良好な分岐カバレッジや条件カバレッジが達成されているかもしれません。ソフトウェア保証のためには、構造カバレッジの数値に加えて、2項、3項などのカバレッジが何パーセント得られているかがわかると有用です。
Definition: For a given test set for n variables, simple t-way combination coverage is the proportion of t-way combinations of n variables for which all variable-values configurations are fully covered.
定義:n個の変数に対する特定のテストセットについて、単純なt-way組合せ網羅率とは、変数値構成のすべてが完全に網羅されているn個の変数のt-way組合せの割合です。
Example. Figure 15 shows an example with four binary variables, a, b, c, and d, where each row represents a test. Of the six 2-way combinations, ab, ac, ad, bc, bd, cd, only bd and cd have all four binary values covered, so simple 2-way coverage for the four tests in Figure 15 is 1/3 = 33.3%. There are four 3-way combinations, abc, abd, acd, bcd, each with eight possible configurations: 000, 001, 010, 011, 100, 101, 110, 111. Of the four combinations, none has all eight configurations covered, so simple 3-way coverage for this test set is 0%.
例:図15は4つの2値変数 a、b、c、d の例を示しており、各行が1つのテストを表します。6つの2項組合せ ab、ac、ad、bc、bd、cd のうち、4つの2値の値がすべてカバーされているのは bd と cd だけであるため、図15の4つのテストの単純2項カバレッジは 1/3 = 33.3% です。3項組合せは abc、abd、acd、bcd の4つであり、それぞれに 000、001、010、011、100、101、110、111 の8通りの構成がありうます。4つの組合せのいずれも8通りの構成すべてがカバーされてはいないため、このテストセットの単純3項カバレッジは0%です。
| a | b | c | d |
|---|---|---|---|
| 0 | 0 | 0 | 0 |
| 0 | 1 | 1 | 0 |
| 1 | 0 | 0 | 1 |
| 0 | 1 | 1 | 1 |
| a | b | c | d |
|---|---|---|---|
| 0 | 0 | 0 | 0 |
| 0 | 1 | 1 | 0 |
| 1 | 0 | 0 | 1 |
| 0 | 1 | 1 | 1 |
Figure 15. An example test array for a system with four binary components
図15. 4つの2値コンポーネントからなるシステムのテスト配列の例
6.2.2 (t + k)-way combination coverage
6.2.2 (t + k) 項組合せカバレッジ
A test set that provides full combinatorial coverage for t-way combinations will also provide some degree of coverage for (t+1)-way combinations, (t+2)-way combinations, etc. This statistic may be useful for comparing two combinatorial test sets. For example, different algorithms may be used to generate 3-way covering arrays. They both achieve 100% 3-way coverage, but if one provides better 4-way and 5-way coverage, then it can be considered to provide more software testing assurance.
t 項組合せについて完全な組合せカバレッジを提供するテストセットは、(t+1) 項組合せ、(t+2) 項組合せなどについても、ある程度のカバレッジを提供します。この統計量は、2つの組合せテストセットを比較する際に有用な場合があります。たとえば、3項カバリング配列の生成に異なるアルゴリズムを使用することがあります。どちらも3項カバレッジ100%を達成しますが、一方がより良い4項・5項カバレッジを提供するなら、そちらのほうがソフトウェアテストとしてより高い保証を提供すると考えられます。
Definition. For a given test set for n variables, (t+k)-way combination coverage is the proportion of (t+k)-way combinations of n variables for which all variable-values configurations are fully covered. (Note that this measure would normally be applied only to a t-way covering array, as a measure of coverage beyond t).
定義: n個の変数に対する所与のテスト集合について、(t+k)-way組合せ網羅率とは、n個の変数の(t+k)-way組合せのうち、すべての変数値構成が完全に網羅されているものの割合です。(この尺度は通常、t-way被覆配列に対し、tを超える網羅率を測る場合にのみ適用します。)
A test set for t-way interactions will also cover some higher strength interactions at t+1, t+2, etc.
t 項相互作用のテストセットは、t+1、t+2 などのより高い強度の相互作用の一部もカバーします。
A test set that provides full combinatorial coverage for \(t\)-way combinations will also provide some degree of coverage for \((t+1)\)-way combinations, \((t+2)\)-way combinations, etc. This statistic may be useful for comparing two combinatorial test sets.
\(t\)-wayの組合せについて完全な組合せ網羅率を達成するテスト集合は、\((t+1)\)-wayの組合せ、\((t+2)\)-wayの組合せなどについても、ある程度の網羅率を達成します。この統計量は、二つの組合せテスト集合を比較するのに役立つことがあります。
Example. If the test set in Figure 15 is extended as shown in Figure 16, we can extend 3-way coverage. For this test set, bcd is covered, out of the four 3-way combinations, so 2-way coverage is 100%, and (2+1)-way = 3-way coverage is 25%.
例:図15のテストセットを図16のように拡張すると、3項カバレッジを拡大できます。このテストセットでは、4つの3項組合せのうち bcd がカバーされるため、2項カバレッジは100%、(2+1) 項 = 3項カバレッジは25%となります。
| a | b | c | d |
|---|---|---|---|
| 0 | 0 | 0 | 0 |
| 0 | 1 | 1 | 0 |
| 1 | 0 | 0 | 1 |
| 0 | 1 | 1 | 1 |
| 0 | 1 | 0 | 1 |
| 1 | 0 | 1 | 1 |
| 1 | 0 | 1 | 0 |
| 0 | 1 | 0 | 0 |
| a | b | c | d |
|---|---|---|---|
| 0 | 0 | 0 | 0 |
| 0 | 1 | 1 | 0 |
| 1 | 0 | 0 | 1 |
| 0 | 1 | 1 | 1 |
| 0 | 1 | 0 | 1 |
| 1 | 0 | 1 | 1 |
| 1 | 0 | 1 | 0 |
| 0 | 1 | 0 | 0 |
Figure 16. Eight tests for four binary variables.
図16. 4つの二値変数に対する8件のテスト。
6.2.3 Variable-Value Configuration coverage
6.2.3 変数値構成の網羅率
So far we have only considered measures of the proportion of combinations for which all configurations of \(t\) variables are fully covered. But when \(t\) variables with \(v\) values each are considered, each \(t\)-tuple has \(v^t\) configurations. For example, in pairwise (2-way) coverage of binary variables, every 2-way combination has four configurations: 00, 01, 10, 11. We can define two measures with respect to configurations:
ここまでは、\(t\)個の変数のすべての構成が完全に網羅されている組合せの割合を表す尺度だけを考えてきました。しかし、\(t\)個の変数がそれぞれ\(v\)個の値を持つ場合を考えると、各\(t\)組には\(v^t\)個の構成があります。例えば、二値変数のペアワイズ(2-way)網羅では、どの2-way組合せにも00、01、10、11の四つの構成があります。構成に関して、次の二つの尺度を定義できます。
Definition. For a given combination of t variables, variable-value configuration coverage is the proportion of variable-value configurations that are covered.
定義: t個の変数の所与の組合せについて、変数値構成網羅率とは、網羅されている変数値構成の割合です。
Definition. For a given set of \(n\) variables, \((p, t)\)-completeness is the proportion of the \(\mathrm{C}(n, t)\) combinations that have configuration coverage of at least \(p\) [50].
定義: \(n\)個の変数の所与の集合について、\((p, t)\)-完全性とは、\(\mathrm{C}(n, t)\)個の組合せのうち、構成網羅率が少なくとも\(p\)であるものの割合です [50]。
Example. For Figure 16 above, there are \(\mathrm{C}(4, 2) = 6\) possible variable combinations and \(\mathrm{C}(4,2)2^2 = 24\) possible variable-value configurations. Of these, 19 variable-value configurations are covered and the only ones missing are \(ab=11\), \(ac=11\), \(ad=10\), \(bc=01\), \(bc=10\). But only two, \(bd\) and \(cd\), are covered with all 4 value pairs. So for the basic definition of simple \(t\)-way coverage, we have only 33% (2/6) coverage, but 79% (19/24) for the configuration coverage metric. For a better understanding of this test set, we can compute the configuration coverage for each of the six variable combinations, as shown in Figure 17. So for this test set, one of the combinations (\(bc\)) is covered at the 50% level, three (\(ab\), \(ac\), \(ad\)) are covered at the 75% level, and two (\(bd\), \(cd\)) are covered at the 100% level. And, as noted above, for the whole set of tests, 79% of variable-value configurations are covered. All 2-way combinations have at least 50% configuration coverage, so \((.50, 2)\)-completeness for this set of tests is 100%.
例: 上記の図16では、変数の組合せは\(\mathrm{C}(4, 2) = 6\)通り、変数値構成は\(\mathrm{C}(4,2)2^2 = 24\)通りあります。このうち19通りの変数値構成が網羅されており、欠けているのは\(ab=11\)、\(ac=11\)、\(ad=10\)、\(bc=01\)、\(bc=10\)だけです。ただし、値の4ペアすべてが網羅されているのは\(bd\)と\(cd\)の2組だけです。したがって、基本的な単純\(t\)-way網羅の定義では網羅率は33% (2/6)にすぎませんが、構成網羅率の尺度では79% (19/24)となります。このテスト集合をよりよく理解するため、図17に示すように、6つの変数組合せそれぞれの構成網羅率を計算できます。このテスト集合では、組合せの1つ(\(bc\))が50%の水準で網羅され、3つ(\(ab\)、\(ac\)、\(ad\))が75%の水準で網羅され、2つ(\(bd\)、\(cd\))が100%の水準で網羅されます。また前述のとおり、テスト集合全体では変数値構成の79%が網羅されます。すべての2-way組合せが少なくとも50%の構成網羅率を持つため、このテスト集合の\((.50, 2)\)-完全性は100%です。
Although the example in Figure 17 uses variables with the same number of values, this is not essential for the measurement. Coverage measurement tools that we have developed compute coverage for test sets in which parameters have differing numbers of values, as shown in Figure 18 and Figure 19.
図17の例では値の数が同じ変数を使っていますが、これは測定に必須ではありません。我々が開発した網羅率測定ツールは、図18および図19に示すように、パラメーターごとに値の数が異なるテスト集合についても網羅率を計算します。
| Vars | Configurations covered | Config coverage |
|---|---|---|
| a b | 00, 01, 10 | .75 |
| a c | 00, 01, 10 | .75 |
| a d | 00, 01, 11 | .75 |
| b c | 00, 11 | .50 |
| b d | 00, 01, 10, 11 | 1.0 |
| c d | 00, 01, 10, 11 | 1.0 |
| 変数 | 網羅された構成 | 構成網羅率 |
|---|---|---|
| a b | 00, 01, 10 | .75 |
| a c | 00, 01, 10 | .75 |
| a d | 00, 01, 11 | .75 |
| b c | 00, 11 | .50 |
| b d | 00, 01, 10, 11 | 1.0 |
| c d | 00, 01, 10, 11 | 1.0 |
• \((.50, 2)\)-completeness \(= 6/6 = 1.0\)
• \((.50, 2)\)-完全性 \(= 6/6 = 1.0\)
• \((.75, 2)\)-completeness \(= 5/6 = 0.83333\)
• \((1.0, 2)\)-completeness \(= 2/6 = 0.33333\)
• \((.75, 2)\)-完全性 \(= 5/6 = 0.83333\)
• \((1.0, 2)\)-完全性 \(= 2/6 = 0.33333\)
Figure 17. The test array covers all possible 2-way combinations of a, b, c, and d to different levels.
図17. テスト配列は a、b、c、d のすべての2項組合せを、それぞれ異なる水準でカバーします。
Figure 18 is an example of coverage for a \(2^{87}3^{2}4^{5}\) set (87 binary, two 3-value, and five 4-value) of input variables (blue=2-way, pink=3-way, yellow=4-way). This particular test set was not a covering array, but pairwise coverage is still quite good, with about 95% of the variables having all possible 2-way configurations covered. Even for 4-way combinations we see that all variables have at least 28% of their configurations covered, and about 25% of them have about 98% or more of 4-way configurations covered. Figure 19 shows a similar plot for a \(2^{79}3^{1}4^{1}6^{1}9^{1}\) configuration.
図18は、\(2^{87}3^{2}4^{5}\)(2値87個、3値2個、4値5個)の入力変数の集合に対するカバレッジの例です(青=2-way、ピンク=3-way、黄=4-way)。このテストセットはカバリング配列ではありませんでしたが、ペアワイズカバレッジはなお非常に良好であり、変数の約95%について、考えられるすべての2-way構成がカバーされています。4-way組合せでも、すべての変数について構成の少なくとも28%がカバーされており、その約25%では4-way構成の約98%以上がカバーされています。図19は、\(2^{79}3^{1}4^{1}6^{1}9^{1}\) の構成に対する同様のプロットです。
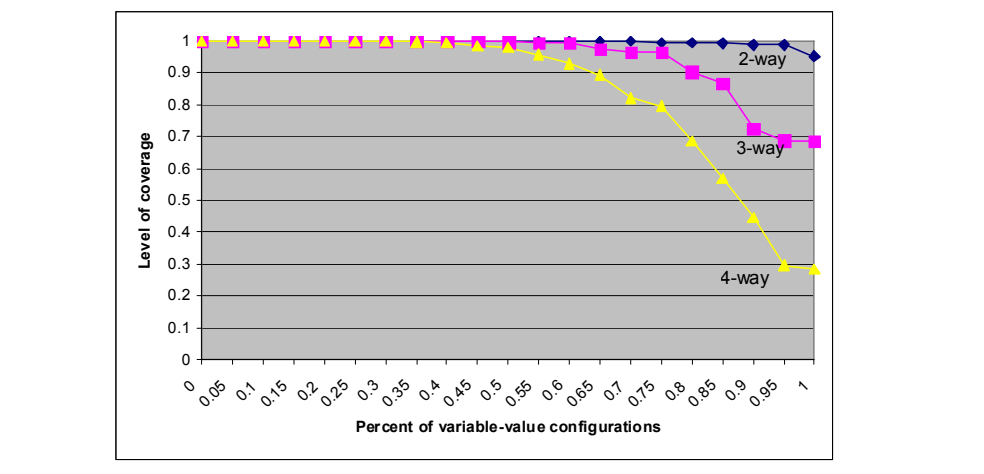
図18. 2^87 3^2 4^5 の入力に対する構成カバレッジ。灰色の描画領域をもつ、枠で囲まれた折れ線グラフである。横軸「Percent of variable-value configurations」(変数値の構成の割合)は0から1まで0.05刻み、縦軸「Level of coverage」(カバレッジの水準)は0から1まで0.1刻みである。印の付いた3本の線に 2-way(紺の菱形)、3-way(赤紫の四角)、4-way(黄色の三角)と記されている。2-way の線はほぼ1のまま推移し、右端で約0.95に下がる。3-way の線は約0.6までほぼ1で、右端で約0.69に下がる。4-way の線は約0.45までほぼ1で、右端で約0.29に下がる。数値は記されていない。
Figure 18. Configuration coverage for \(2^{87}3^{2}4^{5}\) inputs.
図18. \(2^{87}3^{2}4^{5}\) の入力に対する構成カバレッジ
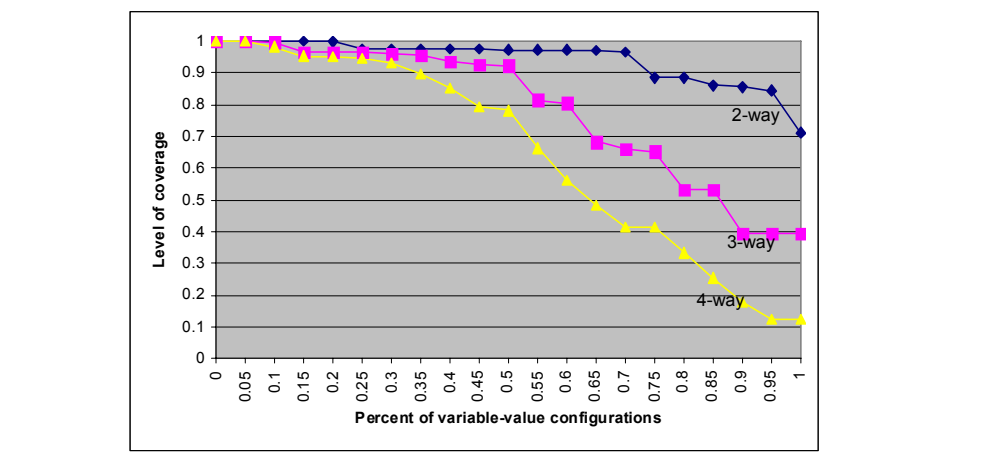
図19. 2^79 3^1 4^1 6^1 9^1 の入力に対する構成カバレッジ。灰色の描画領域をもつ、枠で囲まれた折れ線グラフで、軸は図18と同じである(横軸「Percent of variable-value configurations」は0から1まで0.05刻み、縦軸「Level of coverage」は0から1まで0.1刻み)。印の付いた3本の線に 2-way(紺の菱形)、3-way(赤紫の四角)、4-way(黄色の三角)と記されている。2-way の線は約0.7までほぼ1で、右端で約0.71に下がる。3-way の線は約0.15から下がり始め、右端で約0.39になる。4-way の線は約0.1から下がり始め、右端で約0.12になる。数値は記されていない。
Figure 19. Configuration coverage for \(2^{79}3^{1}4^{1}6^{1}9^{1}\) inputs.
図19. \(2^{79}3^{1}4^{1}6^{1}9^{1}\) の入力に対する構成カバレッジ
6.3 Cost and Practical Considerations
6.3 コストと実務上の考慮事項
An important cost advantage introduced by coverage measurement is the ability to use existing test sets, identify particular combinations that may be missing, and supplement existing tests. In some cases, as in the example of Figure 18, it may be discovered that the existing test set is already strong with respect to a particular strength t (in this case 2-way), and tests for t+1 generated. The tradeoff in cost of applying coverage measurement is the need to map existing tests into discrete numerical values that can be analyzed by the coverage measurement tools (see Appendix C). For example, the days of the week in the example of Figure 10 would have to be mapped into 0 - 6 or 1 - 7. Future versions of the coverage measurement tools may include more flexibility in handling parameter values.
カバレッジ測定がもたらす重要なコスト上の利点は、既存のテストセットを活用し、欠けている可能性のある特定の組合せを特定して、既存のテストを補えることです。図18の例のように、既存のテストセットが特定の強度 t(この場合は2項)についてすでに十分であることが判明し、t+1 のテストを生成する場合もあります。カバレッジ測定を適用するコストとのトレードオフは、カバレッジ測定ツールで分析できる離散的な数値に既存のテストを対応付ける必要があることです(付録C を参照してください)。たとえば、図10の例における曜日は、0〜6 または 1〜7 に対応付けなければなりません。カバレッジ測定ツールの将来のバージョンでは、パラメータ値の扱いがより柔軟になる可能性があります。
6.4 Chapter Summary
6.4 本章のまとめ
1.1. Many coverage measures have been devised for code coverage, including statement, branch or decision, condition, and modified condition decision coverage. These measures are based on aspects of source code and are not suitable for combinatorial coverage measurement.
1.1. コード網羅率については、文網羅、分岐網羅または判定網羅、条件網羅、改良条件判定網羅など、多くの網羅率尺度が考案されています。これらの尺度はソースコードの側面に基づいており、組合せ網羅率の測定には適しません。
2. Measuring configuration-spanning coverage can be helpful in understanding state space coverage. If we do use combinatorial testing, then configuration-spanning coverage will be 100% for the level of \(t\) that was selected, but we may still want to investigate the coverage our test set provides for \(t+1\) or \(t+2\). Calculating this statistic can help in choosing between t-way covering arrays generated by different algorithms. As seen in the examples above, it may be relatively easy to produce tests that provide a high degree of spanning coverage, even if not 100%. In many cases it may be possible to generate additional tests to boost the coverage of a test set.
2. 構成をまたぐ網羅率を測定することは、状態空間の網羅率を理解するうえで役立つことがあります。組合せテストを実際に用いる場合、選択した\(t\)の水準では構成をまたぐ網羅率は100%になりますが、それでも、テスト集合が\(t+1\)や\(t+2\)について達成する網羅率を調べたいことがあります。この統計量を計算すると、異なるアルゴリズムで生成したt-way被覆配列のどれを選ぶかを決める助けになります。上の例で見たように、100%でなくとも、構成をまたぐ網羅率の高いテストを作成することは比較的容易な場合があります。多くの場合、テスト集合の網羅率を高める追加のテストを生成できます。
7 COMBINATORIAL AND RANDOM TESTING
7 組合せテストとランダムテスト
For testing to be most efficient and effective, we need an understanding of when a particular test method is most appropriate. That is, what characteristics of a problem lead us to use one form of testing over another, and what are the tradeoffs with respect to cost and effectiveness? Some studies have compared the effectiveness of combinatorial and random approaches to testing, but have reached conflicting results [3, 4, 56, 58]. This chapter presents an analysis [37, 38] of these two methods and discusses how random testing may complement combinatorial methods.
テストを最も効率的かつ効果的に行うには、特定のテスト方法が最も適切となる状況を理解する必要があります。つまり、問題のどのような特性を根拠に一方の試験方式を他方より選ぶのか、またコストと有効性に関するトレードオフは何か。組合せ方式とランダム方式の有効性を比較した研究はいくつかありますが、結論は一致していません [3, 4, 56, 58]。本章では、これら2つの方法を分析し [37, 38]、ランダムテストが組合せ手法をどのように補完できるかを論じます。
7.1 Coverage of Random Tests
7.1 ランダムテストの網羅率
Because a significant percentage of failures can only be triggered by the interaction of two or more variables, one consideration in comparing random and combinatorial testing is the degree to which random testing covers particular t-way combinations. Table 10 gives the percentage of t-way combinations covered by a randomly generated test set of the same size as a t-way covering array, for various combinations of k = number of variables and v = number of values per variable. Note that the coverage could vary with different realizations of randomly generated test sets. That is, a different random number generator, or even multiple runs of the same generator, may produce slightly different coverage (perhaps a few tests out of thousands, depending on the problem). Figure 20 through Figure 24 summarize the coverage for arrays with variables of 2 to 10 values. As seen in the figures, the coverage provided by a random test suite versus a covering array of the same size varies considerably with different configurations.
かなりの割合の障害は、2つ以上の変数の相互作用によってのみ引き起こされるため、ランダムテストと組合せテストを比較する際の検討事項の1つは、ランダムテストが特定のt-way組合せをどの程度網羅するかです。表10は、k(変数の数)とv(変数あたりの値の数)のさまざまな組合せについて、t-way被覆配列と同じサイズのランダム生成テスト集合が網羅するt-way組合せの割合を示します。ランダム生成テスト集合の実現によって網羅率が異なる場合があることに注意されました。すなわち、異なる乱数生成器、または同じ生成器を複数回実行した場合でも、網羅率がわずかに異なることがあります(問題によっては、数千件中数件程度)。図20から図24は、変数が2~10個の値を持つ配列の網羅率をまとめています。図が示すように、同じサイズの被覆配列と比較したランダムテストスイートの網羅率は、構成によって大きく異なります。
Now consider the size of a random test set required to provide 100% combination coverage. With the most efficient covering array algorithms, the difficulty of finding tests with high coverage increases as tests are generated. Thus even if a randomly generated test set provides better than 99% of the coverage of an equal sized covering array, it should not be concluded that only a few more tests are needed for the random set to provide 100% coverage. Table 11 gives the sizes of randomly generated test sets required for 100% combinatorial coverage at various configurations, and the ratio of these sizes to covering arrays computed with ACTS. Although there is considerable variation among configurations, note that the ratio of random to combinatorial test set size for 100% coverage exceeds 3 in most cases, with average ratios of 3.9, 3.8, and 3.2 at t = 2, 3, and 4 respectively. Thus, combinatorial testing retains a significant advantage over random testing if the goal is 100% combination coverage for a given value of t.
次に、組合せ網羅率を100%にするために必要なランダムテスト集合のサイズを考えます。最も効率的な被覆配列アルゴリズムでは、テストを生成するにつれて、高い網羅率をもたらすテストを見つけることが難しくなります。したがって、ランダム生成テスト集合が同じサイズの被覆配列の網羅率の99%を超える網羅率を提供するとしても、ランダム集合で100%網羅するために必要なテストがあとわずかであると結論してはなりません。表11は、さまざまな構成で組合せ網羅率を100%にするために必要なランダム生成テスト集合のサイズと、ACTSで計算した被覆配列に対するそのサイズの比を示します。構成によってかなりばらつきがありますが、100%網羅に必要なランダムテスト集合と組合せテスト集合のサイズ比は、ほとんどの場合3を超えます。t = 2、3、4での平均比は、それぞれ3.9、3.8、3.2です。したがって、所与のtについて組合せ網羅率100%を目指す場合、組合せテストはランダムテストに対して大きな優位性を保ちます。
| Vars | Values/ Variable | ACTS 2-way tests | Random 2-way coverage | ACTS 3-way tests | Random 3-way coverage | ACTS 4-way tests | Random 4-way coverage |
|---|---|---|---|---|---|---|---|
| 10 | 2 | 10 | 89.28% | 20 | 92.18% | 42 | 92.97% |
| 10 | 4 | 30 | 86.38% | 151 | 89.90% | 657 | 92.89% |
| 10 | 6 | 66 | 84.03% | 532 | 91.82% | 3843 | 94.86% |
| 10 | 8 | 117 | 83.37% | 1214 | 90.93% | 12010 | 94.69% |
| 10 | 10 | 172 | 82.21% | 2367 | 90.71% | 29231 | 94.60% |
| 15 | 2 | 10 | 96.15% | 24 | 97.08% | 58 | 98.36% |
| 15 | 4 | 33 | 89.42% | 179 | 93.75% | 940 | 97.49% |
| 15 | 6 | 77 | 89.03% | 663 | 95.49% | 5243 | 98.26% |
| 15 | 8 | 125 | 85.27% | 1551 | 95.21% | 16554 | 98.25% |
| 15 | 10 | 199 | 86.75% | 3000 | 94.96% | 40233 | 98.21% |
| 20 | 2 | 12 | 97.22% | 27 | 97.08% | 66 | 98.41% |
| 20 | 4 | 37 | 90.07% | 209 | 96.40% | 1126 | 98.79% |
| 20 | 6 | 86 | 91.37% | 757 | 97.07% | 6291 | 99.21% |
| 20 | 8 | 142 | 89.16% | 1785 | 96.92% | 19882 | 99.22% |
| 20 | 10 | 215 | 88.77% | 3463 | 96.85% | 48374 | 99.20% |
| 25 | 2 | 12 | 96.54% | 30 | 98.26% | 74 | 99.18% |
| 25 | 4 | 39 | 91.67% | 233 | 97.49% | 1320 | 99.43% |
| 25 | 6 | 89 | 92.68% | 839 | 97.94% | 7126 | 99.59% |
| 25 | 8 | 148 | 90.46% | 1971 | 97.93% | 22529 | 99.59% |
| 25 | 10 | 229 | 89.80% | 3823 | 97.82% | 54856 | 99.58% |
| 変数 | 変数あたりの値の数 | ACTS 2-wayテスト | ランダム 2-way網羅率 | ACTS 3-wayテスト | ランダム 3-way網羅率 | ACTS 4-wayテスト | ランダム 4-way網羅率 |
|---|---|---|---|---|---|---|---|
| 10 | 2 | 10 | 89.28% | 20 | 92.18% | 42 | 92.97% |
| 10 | 4 | 30 | 86.38% | 151 | 89.90% | 657 | 92.89% |
| 10 | 6 | 66 | 84.03% | 532 | 91.82% | 3843 | 94.86% |
| 10 | 8 | 117 | 83.37% | 1214 | 90.93% | 12010 | 94.69% |
| 10 | 10 | 172 | 82.21% | 2367 | 90.71% | 29231 | 94.60% |
| 15 | 2 | 10 | 96.15% | 24 | 97.08% | 58 | 98.36% |
| 15 | 4 | 33 | 89.42% | 179 | 93.75% | 940 | 97.49% |
| 15 | 6 | 77 | 89.03% | 663 | 95.49% | 5243 | 98.26% |
| 15 | 8 | 125 | 85.27% | 1551 | 95.21% | 16554 | 98.25% |
| 15 | 10 | 199 | 86.75% | 3000 | 94.96% | 40233 | 98.21% |
| 20 | 2 | 12 | 97.22% | 27 | 97.08% | 66 | 98.41% |
| 20 | 4 | 37 | 90.07% | 209 | 96.40% | 1126 | 98.79% |
| 20 | 6 | 86 | 91.37% | 757 | 97.07% | 6291 | 99.21% |
| 20 | 8 | 142 | 89.16% | 1785 | 96.92% | 19882 | 99.22% |
| 20 | 10 | 215 | 88.77% | 3463 | 96.85% | 48374 | 99.20% |
| 25 | 2 | 12 | 96.54% | 30 | 98.26% | 74 | 99.18% |
| 25 | 4 | 39 | 91.67% | 233 | 97.49% | 1320 | 99.43% |
| 25 | 6 | 89 | 92.68% | 839 | 97.94% | 7126 | 99.59% |
| 25 | 8 | 148 | 90.46% | 1971 | 97.93% | 22529 | 99.59% |
| 25 | 10 | 229 | 89.80% | 3823 | 97.82% | 54856 | 99.58% |
Table 10. Percent of t-way combinations covered by equal number of random tests
表10. 同数のランダムテストによってカバーされる t 項組合せの割合
| Vars | Values | 2-way Tests | 3-way Tests | 4-way Tests | ||||||
|---|---|---|---|---|---|---|---|---|---|---|
| ACTS Tests | Random Tests | Ratio | ACTS Tests | Random Tests | Ratio | ACTS Tests | Random Tests | Ratio | ||
| 10 | 2 | 10 | 18 | 1.80 | 20 | 61 | 3.05 | 42 | 150 | 3.57 |
| 10 | 4 | 30 | 145 | 4.83 | 151 | 914 | 6.05 | 657 | 2256 | 3.43 |
| 10 | 6 | 66 | 383 | 5.80 | 532 | 1984 | 3.73 | 3843 | 13356 | 3.48 |
| 10 | 8 | 117 | 499 | 4.26 | 1214 | 5419 | 4.46 | 12010 | 52744 | 4.39 |
| 10 | 10 | 172 | 808 | 4.70 | 2367 | 11690 | 4.94 | 29231 | 137590 | 4.71 |
| 15 | 2 | 10 | 20 | 2.00 | 24 | 52 | 2.17 | 58 | 130 | 2.24 |
| 15 | 4 | 33 | 121 | 3.67 | 179 | 672 | 3.75 | 940 | 2568 | 2.73 |
| 15 | 6 | 77 | 294 | 3.82 | 663 | 2515 | 3.79 | 5243 | 17070 | 3.26 |
| 15 | 8 | 125 | 551 | 4.41 | 1551 | 6770 | 4.36 | 16554 | 60568 | 3.66 |
| 15 | 10 | 199 | 940 | 4.72 | 3000 | 15234 | 5.08 | 40233 | 159870 | 3.97 |
| 20 | 2 | 12 | 23 | 1.92 | 27 | 70 | 2.59 | 66 | 140 | 2.12 |
| 20 | 4 | 37 | 140 | 3.78 | 209 | 623 | 2.98 | 1126 | 3768 | 3.35 |
| 20 | 6 | 86 | 288 | 3.35 | 757 | 2563 | 3.39 | 6291 | 18798 | 2.99 |
| 20 | 8 | 142 | 630 | 4.44 | 1785 | 8450 | 4.73 | 19882 | 59592 | 3.00 |
| 20 | 10 | 215 | 1028 | 4.78 | 3463 | 14001 | 4.04 | 48374 | 157390 | 3.25 |
| 25 | 2 | 12 | 34 | 2.83 | 30 | 70 | 2.33 | 74 | 174 | 2.35 |
| 25 | 4 | 39 | 120 | 3.08 | 233 | 790 | 3.39 | 1320 | 3520 | 2.67 |
| 25 | 6 | 89 | 327 | 3.67 | 839 | 2890 | 3.44 | 7126 | 19632 | 2.75 |
| 25 | 8 | 148 | 845 | 5.71 | 1971 | 7402 | 3.76 | 22529 | 61184 | 2.72 |
| 25 | 10 | 229 | 1031 | 4.50 | 3823 | 16512 | 4.32 | 54856 | 191910 | 3.50 |
| Ratio Average: | 3.90 | 3.82 | 3.21 | |||||||
| 変数 | 値 | 2-wayテスト | 3-wayテスト | 4-wayテスト | ||||||
|---|---|---|---|---|---|---|---|---|---|---|
| ACTSテスト | ランダムテスト | 比 | ACTSテスト | ランダムテスト | 比 | ACTSテスト | ランダムテスト | 比 | ||
| 10 | 2 | 10 | 18 | 1.80 | 20 | 61 | 3.05 | 42 | 150 | 3.57 |
| 10 | 4 | 30 | 145 | 4.83 | 151 | 914 | 6.05 | 657 | 2256 | 3.43 |
| 10 | 6 | 66 | 383 | 5.80 | 532 | 1984 | 3.73 | 3843 | 13356 | 3.48 |
| 10 | 8 | 117 | 499 | 4.26 | 1214 | 5419 | 4.46 | 12010 | 52744 | 4.39 |
| 10 | 10 | 172 | 808 | 4.70 | 2367 | 11690 | 4.94 | 29231 | 137590 | 4.71 |
| 15 | 2 | 10 | 20 | 2.00 | 24 | 52 | 2.17 | 58 | 130 | 2.24 |
| 15 | 4 | 33 | 121 | 3.67 | 179 | 672 | 3.75 | 940 | 2568 | 2.73 |
| 15 | 6 | 77 | 294 | 3.82 | 663 | 2515 | 3.79 | 5243 | 17070 | 3.26 |
| 15 | 8 | 125 | 551 | 4.41 | 1551 | 6770 | 4.36 | 16554 | 60568 | 3.66 |
| 15 | 10 | 199 | 940 | 4.72 | 3000 | 15234 | 5.08 | 40233 | 159870 | 3.97 |
| 20 | 2 | 12 | 23 | 1.92 | 27 | 70 | 2.59 | 66 | 140 | 2.12 |
| 20 | 4 | 37 | 140 | 3.78 | 209 | 623 | 2.98 | 1126 | 3768 | 3.35 |
| 20 | 6 | 86 | 288 | 3.35 | 757 | 2563 | 3.39 | 6291 | 18798 | 2.99 |
| 20 | 8 | 142 | 630 | 4.44 | 1785 | 8450 | 4.73 | 19882 | 59592 | 3.00 |
| 20 | 10 | 215 | 1028 | 4.78 | 3463 | 14001 | 4.04 | 48374 | 157390 | 3.25 |
| 25 | 2 | 12 | 34 | 2.83 | 30 | 70 | 2.33 | 74 | 174 | 2.35 |
| 25 | 4 | 39 | 120 | 3.08 | 233 | 790 | 3.39 | 1320 | 3520 | 2.67 |
| 25 | 6 | 89 | 327 | 3.67 | 839 | 2890 | 3.44 | 7126 | 19632 | 2.75 |
| 25 | 8 | 148 | 845 | 5.71 | 1971 | 7402 | 3.76 | 22529 | 61184 | 2.72 |
| 25 | 10 | 229 | 1031 | 4.50 | 3823 | 16512 | 4.32 | 54856 | 191910 | 3.50 |
| Ratio Average: | 3.90 | 3.82 | 3.21 | |||||||
Table 11. Size of random test set required for 100% t-way combination coverage.
表11. t 項組合せカバレッジ100%に必要なランダムテストセットのサイズ
| Values per variable | Ratio, 2-way | Ratio, 3-way | Ratio, 4-way |
|---|---|---|---|
| 2 | 2.14 | 2.54 | 2.57 |
| 4 | 3.84 | 4.04 | 3.04 |
| 6 | 4.16 | 3.59 | 3.12 |
| 8 | 4.70 | 4.33 | 3.44 |
| 10 | 4.68 | 4.59 | 3.86 |
| 変数あたりの値の数 | 比(2-way) | 比(3-way) | 比(4-way) |
|---|---|---|---|
| 2 | 2.14 | 2.54 | 2.57 |
| 4 | 3.84 | 4.04 | 3.04 |
| 6 | 4.16 | 3.59 | 3.12 |
| 8 | 4.70 | 4.33 | 3.44 |
| 10 | 4.68 | 4.59 | 3.86 |
Table 12. Average ratio of random/ACTS for covering arrays by values per variable, variables = 10, 15, 20, 25
表12. 変数あたりの値の数別に見た、カバリング配列のランダム/ACTS の平均比率(変数 = 10、15、20、25)
7.2 Comparing Random and Combinatorial Coverage
7.2 ランダム網羅率と組合せ網羅率の比較
The comparisons between random and combinatorial testing suggest a number of conclusions:
ランダムテストと組合せテストの比較から、次のような結論が得られる:
•For binary variables (v=2), random tests compare reasonably well with covering arrays (96% to 99% coverage) for all three values (2, 3, and 4) of t for 15 or more variables. Thus random testing for a SUT with all or mostly binary variables may compare favorably with combinatorial testing.
•二値変数(v=2)では、変数数が15以上の場合、tの3つの値(2、3、4)のすべてについて、ランダムテストは被覆配列とかなりよく比較できます(網羅率96%~99%)。したがって、すべてまたは大半が二値変数であるSUTに対するランダムテストは、組合せテストと比べて遜色ない場合があります。
•Combination coverage provided by random generation of the equivalent number of pairwise tests at (t = 2) decreases as the number of values per variable increases, and the coverage provided by pairwise testing is significantly less than 100%. The effectiveness of random testing relative to pairwise testing should be expected to decline as the average number of values per variable increases.
•t = 2のペアワイズテストと同数のテストをランダム生成した場合に得られる組合せ網羅率は、変数あたりの値の数が増えるにつれて低下し、ペアワイズテストによる網羅率は100%を大きく下回ります。変数あたりの平均値数が増えるほど、ペアワイズテストに対するランダムテストの有効性は低下すると考えられます。
•For 4-way interactions, coverage provided by random test generation increases with the number of variables. Combinatorial testing for a module with approximately 10 variables should be significantly more effective than random testing, while the difference between the two test methods should be less for modules with 20 or more variables.
•4-way相互作用では、ランダムテスト生成による網羅率は変数数の増加とともに上昇します。約10変数のモジュールでは組合せテストがランダムテストより大幅に有効である一方、20以上の変数を持つモジュールでは、2つのテスト方法の差は小さくなるはずです。
•For 100% combination coverage, the efficiency advantage of combinatorial testing varies directly with the number of values per variable and inversely with the interaction strength t. Figure 25 illustrates how these factors (interaction strength t and values per variable v) combine: the ratio of random/combinatorial coverage is highest for 10 variables with t = 2, but declines for other pairings of t and v. To obtain 100% combination coverage, random testing is significantly less efficient than combinatorial testing, requiring 2 to nearly 5 times as many tests as a covering array generated by ACTS. Thus if 100% combination coverage is desired, combinatorial testing should be significantly less expensive than random test generation.
•組合せ網羅率100%を達成する場合、組合せテストの効率上の優位性は、変数あたりの値の数に比例し、相互作用強度tに反比例して変化します。図25はこれらの要因(相互作用強度tおよび変数あたりの値v)の組合せを示します。ランダム/組合せ網羅率の比は、変数10個、t = 2で最大となりますが、tとvの他の組合せでは低下します。組合せ網羅率を100%にするには、ランダムテストは組合せテストより大幅に効率が低く、ACTSが生成する被覆配列の2倍からほぼ5倍のテストが必要となります。したがって、組合せ網羅率100%が望まれる場合、組合せテストの方がランダムテスト生成より大幅に低コストです。
An important practical consideration in comparing combinatorial with random testing is the efficiency of the covering array generator. Algorithms have a very wide range in the size of covering arrays they produce. It is not uncommon for the better algorithms to produce arrays that are 50% smaller than other algorithms. We have found in comparisons with other tools that there is no uniformly “best” algorithm. Other algorithms may produce smaller or larger combinatorial test suites, so the comparable random test suite will vary in the number of combinations covered. Thus random testing may fare better in comparison with combinatorial tests produced by one of the less efficient algorithms.
組合せテストとランダムテストを比較する際の重要な実務上の考慮事項は、被覆配列生成器の効率です。アルゴリズムによって、生成される被覆配列のサイズには非常に大きな幅があります。優れたアルゴリズムが他のアルゴリズムより50%小さい配列を生成することは珍しくありません。他のツールとの比較では、常に「最良」となるアルゴリズムはないことが分かりました。他のアルゴリズムでは、より小さい、または大きい組合せテストスイートが生成されるため、対応するランダムテストスイートが網羅する組合せ数も変わります。したがって、効率の低いアルゴリズムが生成した組合せテストと比べる場合、ランダムテストの方が良好に見えることがあります。
However there is a less obvious but important tradeoff regarding covering array size. An algorithm that produces a very compact array, i.e., with few tests, for t-way combinations may include fewer (t+1)-way combinations because there are fewer tests. Table 13 and Table 14 illustrate this phenomenon for an example. Table 9 shows the percentage of t+1 up to t+3 combination coverage provided by the ACTS tests and in Table 10 the equivalent number of random tests. Although ACTS pairwise tests
しかし、カバリング配列のサイズに関しては、目立たないが重要なトレードオフがあります。t 項組合せについて非常にコンパクトな配列、すなわちテスト数の少ない配列を生成するアルゴリズムは、テストが少ない分、(t+1) 項組合せを含む数が少なくなる可能性があります。表13と表14は、ある例についてこの現象を示しています。表9は ACTS のテストが提供する t+1 から t+3 までの組合せカバレッジの割合を示し、表10は同数のランダムテストのそれを示します。ACTS のペアワイズテストは
provide better 3-way coverage than the random tests, at other interaction strengths and values of t, the random tests are roughly the same or slightly better in combination coverage than ACTS. Recall from Section 7.1 that pairwise combinatorial tests detected slightly fewer events than the equivalent number of random tests. One possible explanation may be that the superior 4-way and 5-way coverage of the random tests allowed detection of more events. Almost paradoxically, an algorithm that produces a larger, sub-optimal covering array may provide better failure detection because the larger array is statistically more likely to include t+1, t+2, and higher degree interaction tests as a byproduct of the test generation. Again, however, the less optimal covering array is likely to more closely resemble the random test suite in failure detection.
ランダムテストよりも良い3項カバレッジを提供しますが、その他の相互作用強度や t の値では、ランダムテストは組合せカバレッジにおいて ACTS とほぼ同等か、わずかに優れています。7.1節で述べたように、ペアワイズ組合せテストが検出したイベントは、同数のランダムテストよりもわずかに少なかった。考えられる説明の一つは、ランダムテストの4項・5項カバレッジが優れていたために、より多くのイベントを検出できたというものです。ほとんど逆説的ですが、より大きく最適でないカバリング配列を生成するアルゴリズムのほうが、より良い障害検出をもたらす可能性があります。より大きな配列は、テスト生成の副産物として t+1、t+2 およびそれ以上の次数の相互作用テストを含む確率が統計的に高いからです。ただし、ここでもやはり、最適でないカバリング配列は、障害検出の点でランダムテストスイートにより近いものとなる可能性が高いです。
A less optimal (by size) array may provide better failure detection because it includes more interactions at t+1, t+2, etc.
(サイズの点で)最適でない配列は、t+1、t+2 などの相互作用をより多く含むため、より良い障害検出をもたらす可能性があります。
Note also that the number of failures in the SUT can affect the degree to which random testing approaches combinatorial testing effectiveness. For example, suppose the random test set covers 99% of combinations for 4-way interactions, and the SUT contains only one 4-way interaction failure. Then there is a 99% probability that the random tests will contain the 4-way interaction that triggers this failure. However, if the SUT contains \(m\) independent failures, then the probability that combinations for all \(m\) failures are included in the random test set is \(.99^m\). Hence with multiple failures, random testing may be significantly less effective, as its probability of detecting all failures will be \(c^m\), for \(c\) = percent coverage and \(m\) = number of failures.
SUT内の障害数も、ランダムテストが組合せテストの有効性にどの程度近づくかに影響することに注意されました。たとえば、ランダムテスト集合が4-way相互作用の組合せを99%網羅し、SUTに4-way相互作用障害が1つしかないとします。この場合、その障害を引き起こす4-way相互作用がランダムテストに含まれる確率は99%です。しかし、SUTに\(m\)個の独立した障害がある場合、\(m\)個すべての障害に関わる組合せがランダムテスト集合に含まれる確率は\(.99^m\)です。したがって、複数の障害がある場合、すべての障害を検出する確率は\(c^m\)(\(c\) = 網羅率、\(m\) = 障害数)となり、ランダムテストの有効性は大幅に低下する可能性があります。
| t | 3-way coverage | 4-way coverage | 5-way coverage |
|---|---|---|---|
| 2 | .758 | .429 | .217 |
| 3 | .924 | .709 | |
| 4 | .974 |
| t | 3-way網羅率 | 4-way網羅率 | 5-way網羅率 |
|---|---|---|---|
| 2 | .758 | .429 | .217 |
| 3 | .924 | .709 | |
| 4 | .974 |
Table 13. Higher interaction coverage of tway tests
表13. t-wayテストの高次相互作用網羅率
| t | 3-way coverage | 4-way coverage | 5-way coverage |
|---|---|---|---|
| 2 | .735 | .499 | .306 |
| 3 | .917 | .767 | |
| 4 | .974 |
| t | 3-way網羅率 | 4-way網羅率 | 5-way網羅率 |
|---|---|---|---|
| 2 | .735 | .499 | .306 |
| 3 | .917 | .767 | |
| 4 | .974 |
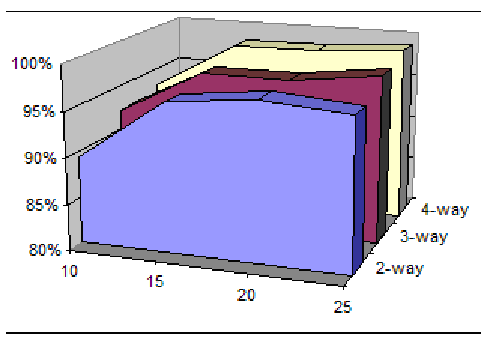
図20. v=2 の場合の t 項組合せのカバレッジ率。3 系列を前後に重ねた 3D 面グラフで、系列は手前から 2-way(青)、3-way(暗赤色)、4-way(淡黄色)と記されている。縦軸は 80% から 100% まで 5% 刻み、横軸には軸名のない目盛 10、15、20、25 がある。2-way の系列が最も低く、左から右へ緩やかに上がる。3-way、4-way の系列は順に高く、100% 近くにある。
Figure 20. Percent coverage of t-way combinations for v=2.
図20. v=2 の場合の t 項組合せのカバレッジ率
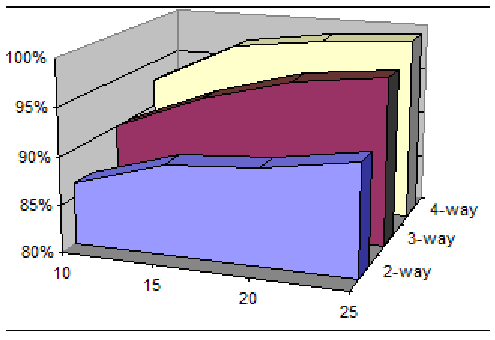
図21. v=4 の場合の t 項組合せのカバレッジ率。3 系列を前後に重ねた 3D 面グラフで、系列は手前から 2-way(青)、3-way(暗赤色)、4-way(淡黄色)と記されている。縦軸は 80% から 100% まで 5% 刻み、横軸には軸名のない目盛 10、15、20、25 がある。2-way の系列が最も低く、左から右へ緩やかに上がる。3-way、4-way の系列は順に高く、100% 近くにある。
Figure 21. Percent coverage of t-way combinations for v=4.
図21. v=4 の場合の t 項組合せのカバレッジ率
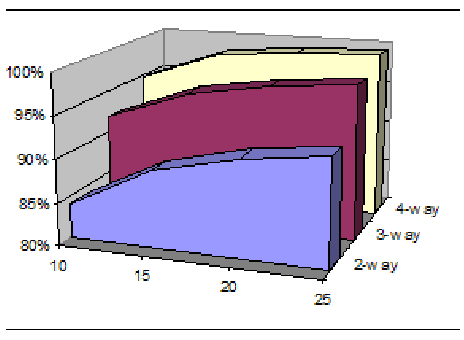
図22. v=6 の場合の t 項組合せのカバレッジ率。3 系列を前後に重ねた 3D 面グラフで、系列は手前から 2-way(青)、3-way(暗赤色)、4-way(淡黄色)と記されている。縦軸は 80% から 100% まで 5% 刻み、横軸には軸名のない目盛 10、15、20、25 がある。2-way の系列が最も低く、左から右へ緩やかに上がる。3-way、4-way の系列は順に高く、100% 近くにある。
Figure 22. Percent coverage of t-way combinations for v=6.
図22. v=6 の場合の t 項組合せのカバレッジ率
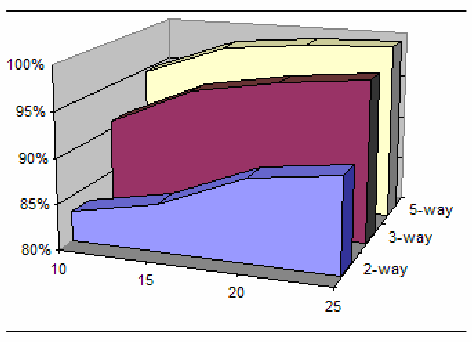
図23. v=8 の場合の t 項組合せのカバレッジ率。3 系列を前後に重ねた 3D 面グラフで、系列は手前から 2-way(青)、3-way(暗赤色)、5-way(淡黄色)と記されている。(この図だけ奥の系列が 5-way と印刷されており、図20〜22・24 では 4-way である。)縦軸は 80% から 100% まで 5% 刻み、横軸には軸名のない目盛 10、15、20、25 がある。2-way の系列が最も低く、左から右へ緩やかに上がる。3-way、5-way の系列は順に高く、100% 近くにある。
Figure 23. Percent coverage of t-way combinations for v=8.
図23. v=8 の場合の t 項組合せのカバレッジ率
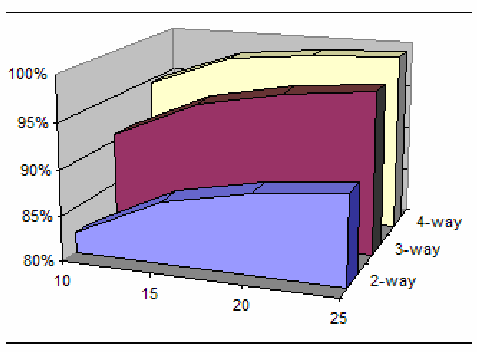
図24. v=10 の場合の t 項組合せのカバレッジ率。3 系列を前後に重ねた 3D 面グラフで、系列は手前から 2-way(青)、3-way(暗赤色)、4-way(淡黄色)と記されている。縦軸は 80% から 100% まで 5% 刻み、横軸には軸名のない目盛 10、15、20、25 がある。2-way の系列が最も低く、左から右へ緩やかに上がる。3-way、4-way の系列は順に高く、100% 近くにある。
Figure 24. Percent coverage of t-way combinations for v=10
図24. v=10 の場合の t 項組合せのカバレッジ率
Figure 25. Average ratio of random/ACTS for covering arrays by values per variable
原文のみ
7.3 Cost and Practical Considerations
7.3 コストと実務上の考慮事項
The relationship between covering arrays and randomly generated tests presents some interesting issues. Generating covering arrays for combinatorial tests is complex; it has been shown to be an NP-hard problem. But generating tests randomly is trivial. Thus for large problems, we can compare the cost and time of generating a covering array versus producing tests randomly, measuring their coverage (Chapter 6), then adding tests as needed to provide full combinatorial coverage. Notice the last column of Table 10. For 4 way tests, once the number of parameters exceeds roughly 20, random generation will cover 99% or more of 4-way combinations. If a problem requires tests for 100 parameters, for example, covering array generators may require hours or days, or may simply be unable to handle that many parameters, but random tests could be generated quickly and easily. This is an option that may be cost effective even for smaller problems, and should be kept in mind for test planning.
被覆配列とランダム生成テストの関係には、興味深い論点があります。組合せテスト用の被覆配列の生成は複雑であり、NP困難な問題であることが示されています。一方、ランダムなテスト生成は容易です。したがって大規模な問題では、被覆配列を生成するコストと時間をランダムにテストを生成するコストと時間と比較し、網羅率を測定し(第6章)、完全な組合せ網羅率を得るため必要に応じてテストを追加できます。表10の最後の列に注目されました。4-wayテストでは、パラメーター数がおよそ20を超えると、ランダム生成により4-way組合せの99%以上が網羅されます。たとえば100個のパラメーターを要する問題では、被覆配列生成器が数時間または数日かかる、あるいはその数のパラメーターを扱えない場合もありますが、ランダムテストなら迅速かつ容易に生成できます。これは小規模な問題でも費用対効果の高い選択肢となる可能性があり、テスト計画で考慮すべきです。
7.4 Chapter Summary
7.4 本章の要約
1. Existing research has shown either no difference (for some problems) or higher failure detection effectiveness (for most problems) for combinatorial testing. Analyzing random test sets suggests a number of reasons for this result. In particular, a highly optimized t-way covering array may include fewer \(t+1\), \(t+2\), and higher degree interaction tests than an equivalent sized random test set. Similarly, a covering array algorithm that produces a larger, sub-optimal array may provide better failure detection because the larger array is statistically more likely to include \(t+1\), \(t+2\), and higher degree interaction tests as a byproduct of the test generation.
1. 既存の研究は、組合せテストについて、(一部の問題では)差がないこと、または(大半の問題では)障害検出の有効性がより高いことを示しています。ランダムテスト集合を分析すると、この結果の理由がいくつか示唆されます。特に、高度に最適化されたt-way被覆配列は、同等の大きさのランダムテスト集合に比べて、\(t+1\)、\(t+2\)、およびそれより高い次数の相互作用のテストを少ししか含まないことがあります。同様に、より大きく最適でない配列を生成する被覆配列アルゴリズムの方が、障害検出に優れることがあります。配列が大きいほど、テスト生成の副産物として\(t+1\)、\(t+2\)、およびそれより高い次数の相互作用のテストを含む可能性が統計的に高くなるからです。
2. While the analysis reported here does not indicate that combinatorial testing is uniformly better than random, it does support a preference for combinatorial methods if the cost of applying the two test approaches is the same. This preference may be particularly relevant if the SUT is likely to contain multiple failures (as is usually the case). Single failures that depend on the interaction of two or more variables have a high likelihood of being detected by random tests, because the random test set may cover a high percentage of all \(t\)-way combinations. But the probability of detecting multiple failures declines rapidly as \(c^m\), for \(c =\) percent coverage and \(m =\) number of independent failures.
2. ここで報告した分析は、組合せテストがランダムテストより一様に優れていることを示すものではありませんが、二つのテスト手法を適用するコストが同じであれば、組合せ手法を選ぶことを支持します。この選好は、SUTが複数の障害を含む可能性が高い場合(通常はそうである)に、特に意味を持つことがあります。二つ以上の変数の相互作用に依存する単一の障害は、ランダムテストで検出される可能性が高い。ランダムテスト集合が、すべての\(t\)-way組合せのうち高い割合を網羅することがあるからです。しかし、複数の障害を検出する確率は\(c^m\)に従って急速に低下します。ここで、\(c =\) 網羅率(パーセント)、\(m =\) 独立した障害の数です。
8 ASSERTION-BASED TEST ORACLES
8 アサーションに基づくテストオラクル
Many programming languages include an assert feature that allows the programmer to specify properties that are assumed true at a particular point in the program. For example, a function that includes a division in which a particular parameter \(\mathrm{x}\) will be used as a divisor may require that this parameter may never be zero. This function may include the C statement assert(x != 0); as the first statement executed. Note that the assertion is not the same as an input validity check that issues an error message if input is not acceptable. The assertion gives conditions that must hold for the function to operate properly, in this case a non-zero divisor. It is the responsibility of the programmer to ensure that a zero divisor is never passed to the function. The distinction between assertions and input validation code is that assertions are intended to catch programming mistakes, while input validation detects errors in user or file/database input.
多くのプログラミング言語にはassert機能があり、プログラマーはプログラム内の特定の時点で真と仮定される性質を指定できます。たとえば、特定のパラメーター\(\mathrm{x}\)を除数として使う除算を含む関数では、このパラメーターが決してゼロにならないことが要求される場合があります。この関数には、最初に実行される文としてCの文assert(x != 0);を含めることができます。このアサーションは、入力が許容できない場合にエラーメッセージを出す入力妥当性検査と同じではない点に注意されました。アサーションは、関数が正しく動作するために成り立たなければならない条件、この場合はゼロでない除数を示します。ゼロの除数が決して関数に渡されないようにするのはプログラマーの責任です。アサーションと入力検証コードの違いは、アサーションがプログラミング上の誤りを捕捉するためのものであるのに対し、入力検証はユーザー入力またはファイル/データベース入力の誤りを検出する点にあります。
With a sufficient number of assertions derived from a specification, the program can have a self-checking property [27, 60, 47]. The assertions can serve as a sort of embedded proof of important properties, such that if the assertions hold for all executions of the program, then the properties encoded in the assertions are guaranteed to hold. Then, if the assertions form a chain of logic that implies a formal statement of program properties, the program’s correctness with respect to these properties can be proven. We can take advantage of this scheme in combinatorial testing by demonstrating that the assertions hold for all t-way combinations of inputs. While this is not the same as a correctness proof, it is an effective way of integrating formal methods for correctness with program testing, and an extensive body of research has developed this idea for practical use (for a survey, see [4]). Some modern programming languages, such as Eiffel [52], include extensive support for including assertions that encode program properties, and tools such as the Java Modeling Language [42] have been designed to integrate assertions with testing. In many cases, using assertions to self-check important properties makes it practical to run thousands of tests in a fully automated fashion, so high-strength interactions of 4-way and above can be done in reasonable time.
仕様から導出した十分な数のアサーションがあれば、プログラムに自己検査の性質を持たせることができます [27, 60, 47]。アサーションは、重要な性質の一種の組込み証明として機能できます。すなわち、プログラムのすべての実行でアサーションが成り立つならば、アサーションに符号化された性質が成り立つことが保証されます。さらに、アサーションがプログラムの性質の形式的な記述を含意する論理の連鎖を形成していれば、それらの性質に関するプログラムの正しさを証明できます。組合せテストでは、入力のすべての t 項組合せについてアサーションが成り立つことを示すことで、この仕組みを活用できます。これは正しさの証明と同じではありませんが、正しさのための形式手法をプログラムテストと統合する効果的な方法であり、この考え方を実用化するための研究が数多く行われてきました(概観については [4] を参照してください)。Eiffel [52] のような一部の現代的なプログラミング言語は、プログラムの性質を符号化するアサーションを組み込むための充実した機能を備えており、Java Modeling Language [42] のようなツールは、アサーションをテストと統合するように設計されています。多くの場合、アサーションを用いて重要な性質を自己検査することにより、数千のテストを完全に自動化して実行することが現実的になるため、4項以上の高強度の相互作用も妥当な時間で扱えます。
8.1 Basic Assertions for Testing
8.1 テストのための基本アサーション
With self-checking through assertions, thousands of tests can often be run at very low cost, allowing high-strength interaction coverage.
アサーションによる自己検査を用いれば、数千のテストを非常に低いコストで実行できることが多く、高強度の相互作用カバレッジが可能になります。
To clarify this somewhat abstract discussion, we will analyze requirements for a small function that handles withdrawal processing for an automated teller machine (ATM). Graphical user interface code for the ATM will not be displayed, as this would vary considerably for different systems. The decision not to include GUI code in this example also illustrates a practical limitation of this type of testing: there are many potential sources of error in a software project, and testing may not deal with all of them at the same time. The GUI code may be analyzed separately, or a more complex verification with assertions may specify properties of the GUI calls, but in the end some human involvement is needed to ensure that the screen information is properly displayed. However, we can do very thorough testing of the most critical aspects of the withdrawal module.
このやや抽象的な議論を明確にするため、現金自動預け払い機(ATM)の引き出し処理を扱う小さな関数の要件を分析します。ATM のグラフィカルユーザインタフェースのコードは、システムによって大きく異なるため示しません。この例に GUI コードを含めないという判断は、この種のテストの実務上の限界も示しています。ソフトウェアプロジェクトには多くの潜在的なエラー源があり、テストはそのすべてを同時に扱えるとは限りません。GUI コードは別途分析してもよいし、より複雑なアサーションによる検証で GUI 呼出しの性質を規定してもよいですが、最終的には画面の情報が正しく表示されることを確認するために人の関与が必要です。とはいえ、引き出しモジュールの最も重要な側面については、非常に徹底したテストを行うことができます。
Requirements for the module are as follows:
このモジュールの要件は次のとおりである:
1.Some accounts have a minimum balance requirement, indicated by boolean variable minflag.
1.一部の口座には最低残高要件があり、ブール変数minflagで示します。
2.The bank allows all customers a basic overdraft protection amount, but for a fee, customers may purchase overdraft protection that exceeds the default.
2.銀行はすべての顧客に基本的な当座貸越保護額を認めますが、手数料を支払えば、顧客は既定値を超える当座貸越保護を購入できます。
3.If the account has a minimum balance, the withdrawal cannot reduce account balance below (minimum balance – overdraft default) unless overdraft protection is set for this account and the allowed overdraft amount for this account exceeds the default, in which case the balance cannot be reduced below (minimum balance – overdraft amount).
3.口座に最低残高が設定されている場合、その口座に当座貸越保護が設定され、かつ許可当座貸越額が既定値を超えているときを除き、出金によって口座残高を(最低残高-既定当座貸越額)未満にしてはなりません。その場合、残高を(最低残高-当座貸越額)未満にしてはなりません。
4.No withdrawals may exceed the default limit (to keep the ATM from running out of cash), although some customers may have a withdrawal limit below this amount, such as minors who have an account with limits placed by parents.
4.ATMの現金切れを防ぐため、出金額は既定上限を超えてはなりません。ただし、親が口座に制限を設けている未成年者など、一部の顧客にはこの額より低い出金限度額が設定される場合があります。
5.The overdraft privilege can be used only once until the balance is made positive again.
5.当座貸越特典は、残高が再び正になるまで一度だけ使用できます。
6.Cards flagged as stolen are to be captured and logged in the hot card file. No withdrawal is allowed for a card flagged as stolen.
6.盗難フラグが付いたカードは回収し、ホットカードファイルに記録します。盗難フラグが付いたカードでは出金を認めません。
The module has these inputs from the user after the user is authorized by another module:
ユーザーが別のモジュールによって認証された後、このモジュールはユーザーから次の入力を受け取る:
string num: the user card number int amt: withdrawal amount requested
string num: ユーザーカード番号 int amt: 要求された出金額
and these inputs from the system:
システムからは次の入力を受け取る:
int balance: user account balance boolean minflag: account has minimum balance requirement int min: account minimum balance boolean odflag: account has overdraft protection int odamt: overdraft protection amount, int oddefault: overdraft default boolean hot: card flagged as stolen boolean limflag: withdrawal limit less than default int limit: withdrawal limit for this account int limdefault: withdrawal limit default
int balance: ユーザー口座残高 boolean minflag: 口座に最低残高要件があるか int min: 口座の最低残高 boolean odflag: 当座貸越保護が設定されているか int odamt: 当座貸越保護額 int oddefault: 既定当座貸越額 boolean hot: カードに盗難フラグが付いているか boolean limflag: 出金限度額が既定値より低いか int limit: この口座の出金限度額 int limdefault: 既定出金限度額
How should these requirements be translated into assertions and used in testing? Consider requirement 1: if minflag is set, then the balance before and after the withdrawal must be no less than the minimum balance amount. This could be translated directly into logic for assertions: minflag => balance >= min. If the assertion facility does not include logical implication, then the equivalent expression can be used, for example, in C syntax: !minflag || balance >= min.
これらの要件をどのようにアサーションに変換し、試験で使用すべきか。要件1を考えます。minflagが設定されている場合、出金前後の残高は最低残高以上でなければなりません。これはアサーション用の論理式に直接変換できる: minflag => balance >= min。アサーション機能が論理含意をサポートしない場合は、同値の式を使用できます。たとえばC構文では、!minflag || balance >= min。
However, we must also consider overdraft protection and withdrawal limits, so the assertion above is not adequate. Collecting conditions, we can develop assertions for each of the eight possible settings of minflag, odflag, and limflag. If there is a minimum balance requirement, no overdraft protection, and a withdrawal limit below the default, what is the relationship between balance and the other parameters?
しかし、当座貸越保護と出金限度額も考慮しなければならないため、上記のアサーションでは不十分です。条件を集めると、minflag、odflag、limflagの8通りの設定それぞれについてアサーションを作成できます。最低残高の要件があり、当座貸越保護がなく、出金限度額が既定値を下回る場合、balanceとその他のパラメータとの関係はどうなりますか。
minflag && !odflag && limflag => balance >= min – oddefault && amt <= limit
minflag && !odflag && limflag => balance >= min – oddefault && amt <= limit
This relation must hold after the withdrawal, so to develop an assertion that must hold immediately before the withdrawal, substitute (balance – amt) for balance in the expression above:
この関係は出金後に成り立たなければならないので、出金の直前に成り立たなければならないアサーションを作成するには、上の式のbalanceを(balance – amt)で置き換えます。
balance0 – amt >= min – oddefault && amt <= limit
balance0 – amt >= min – oddefault && amt <= limit
Assertions such as this would be placed immediately before the balance is modified, not at the beginning of the code for the withdrawal function. Code prior to the subtraction from balance should have ensured that properties encoded by assertions hold immediately before the subtraction, thus any violation of the assertions indicates an error in the code (or possibly in the assertions!) that must be investigated. This is illustrated in Figure 26, where “wdl_init.c” and “wdl_final.c” are files containing assertions such as developed above.
このようなアサーションは、出金関数のコードの冒頭ではなく、balanceが変更される直前に置きます。balanceからの減算より前のコードは、アサーションが符号化した性質が減算の直前に成り立つことを保証していたはずであり、したがってアサーションの違反は、調査が必要なコード(あるいはアサーション自体)の誤りを示します。これは図26に示されており、「wdl_init.c」と「wdl_final.c」は、上のように作成したアサーションを含むファイルです。
Including the card number, there are 11 parameters for this module. We need to partition the inputs to determine what values to use in generating a covering array. Partitions should cover valid and invalid values, minimum and maximum for ranges, and values at and on either side of boundaries. The bank uses a check digit scheme for card numbers to detect errors such as digit transposition when numbers are entered manually. A simple partition could be as follows:
カード番号を含めると、このモジュールのパラメータは11個あります。被覆配列の生成に用いる値を決めるため、入力を分割する必要があります。分割は、有効な値と無効な値、範囲の最小値と最大値、および境界上とその両側の値を網羅すべきです。銀行は、番号を手作業で入力する際の数字の入れ替えなどの誤りを検出するため、カード番号にチェックディジット方式を用いています。単純な分割は次のようになります。
string acct: {valid, invalid} int amt: {0, divisible by 20, not divisible by 20, max} int balance: {0, negative, positive, max int} int minflag: {T, F} int min: {0, negative, positive, max int} boolean odflag: {T, F} int odamt: {0, negative, positive, max int} int oddefault: {0, negative, positive, max int} boolean hot: {T, F} int acctlim: {0, negative, positive, max int} int lim: {0, negative, positive, max int}
string acct: {valid, invalid} int amt: {0, divisible by 20, not divisible by 20, max} int balance: {0, negative, positive, max int} int minflag: {T, F} int min: {0, negative, positive, max int} boolean odflag: {T, F} int odamt: {0, negative, positive, max int} int oddefault: {0, negative, positive, max int} boolean hot: {T, F} int acctlim: {0, negative, positive, max int} int lim: {0, negative, positive, max int}
Using the equivalence classes above, this is thus a \(2^4 4^7\) system, or 262,144 possible inputs. If values on either side of boundaries are used, the number of possible input combinations will be much larger, but using combinatorial methods we can cover 3-way or 4-way combinations with only a few hundred tests.
上記の同値クラスを使うと、これは\(2^4 4^7\)システム、すなわち262,144通りの入力となります。境界の両側の値も使えば、可能な入力組合せの数は大幅に増えますが、組合せ手法を使えば、数百件のテストだけで3-wayまたは4-way組合せを網羅できます。
1.while (!valid(acct)) {/* get account number input */} 2.if (amt > lim ) { return ERROR; } 3.else {
1.while (!valid(acct)) {/* 口座番号入力を取得 */} 2.if (amt > lim ) { return ERROR; } 3.else {
4.if (odflag ) { 5. if (amt > balance + odamt ) 6. { return ERROR; }
4.if (odflag ) { 5. if (amt > balance + odamt ) 6. { return ERROR; }
7.} 8.else {
7.} 8.else {
9.if (amt > balance + oddefault )
9.if (amt > balance + oddefault )
10.{return ERROR; }
10.{return ERROR; }
11.else { 12. if (amt > lim ) 13. { return ERROR; }
11.else { 12. if (amt > lim ) 13. { return ERROR; }
14.}
14.}
15.#include "wdl_init.c"
15.#include "wdl_init.c"
16.balance -= amt ;
16.balance -= amt ;
17.#include "wdl_final.c"
17.#include "wdl_final.c"
18.}
18.}
19.}
19.}
20.}
20.}
Figure 26. Withdrawal function code to be tested.
図26. テスト対象となる出金関数のコード。
8.2 Stronger Assertion-based Testing
8.2 より強力なアサーションベースのテスト
While the method described in the previous section can be very effective in testing, notice that it will be inadequate for many problems, because basic assertion functions such as in C language library do not support important logic operators such as \(\forall\) (for all) and \(\exists\) (for some). Thus expressing simple properties such as \(S\) is sorted in ascending order \(= \forall i : 0 \le i < n-1 : S[i] \le S[i+1]\) cannot be done without a good deal of additional coding. While it would be possible to add code to handle these problems in assertions, a better solution is to use an assertion language that is designed for the purpose and contains all the necessary features.
前節で説明した方法はテストに非常に有効となり得ますが、多くの問題には不十分であることに注意されました。C言語ライブラリにあるような基本的なアサーション関数は、\(\forall\)(すべての)や\(\exists\)(ある)のような重要な論理演算子をサポートしないためです。そのため、\(S\) は昇順に整列されている \(= \forall i : 0 \le i < n-1 : S[i] \le S[i+1]\) のような単純な性質であっても、相当量の追加コーディングなしには表現できません。アサーション内でこうした問題を処理するコードを追加することも可能ではありますが、この目的のために設計され、必要な機能をすべて備えたアサーション言語を使う方がよい。
Tools such as Anna [44] for Ada, the Java Modeling language (JML) [42] and iContract [28] for Java, and APP [57] or Nana [46] for C, can be used to introduce complex assertions, effectively embedding a formal specification within the code. The embedded assertions serve as an executable form of the specification, thus providing an oracle for the testing phase. With embedded assertions, exercising the application with all \(t\)-way combinations can provide reasonable assurance that the code works correctly across a very wide range of inputs. This approach has been used successfully for testing smart cards, with embedded JML assertions acting as an oracle for combinatorial tests [25]. Results showed that 80% - 90% of errors could be found in this way.
Ada用のAnna [44]、Java用のJava Modeling language(JML)[42]およびiContract [28]、C用のAPP [57]またはNana [46]などのツールを使うと、複雑なアサーションを導入でき、実質的に形式仕様をコード内に埋め込めます。埋め込まれたアサーションは仕様の実行可能な形式として働き、テスト段階のオラクルとなります。埋め込みアサーションがあれば、すべての\(t\)-way組合せでアプリケーションを実行することにより、非常に幅広い入力に対してコードが正しく動作するという妥当な保証が得られます。この方法はスマートカードのテストに用いられて成功しており、埋め込まれたJMLアサーションが組合せテストのオラクルとして機能しました[25]。結果は、この方法でエラーの80%〜90%を発見できることを示しました。
8.3 Cost and Practical Considerations
8.3 コストと実務上の考慮事項
Assertions may be a cost-effective approach to test automation because they can be a simple extension of coding. In general, use of assertions is correlated with reduced error rates [41], but a very wide range of effectiveness results from variations in usage. In many applications, assertions are used in a very basic way, such as ensuring that null pointers are not passed to a function that will use them, or that parameters that may be used as divisors are non-zero.
アサーションはコーディングの単純な拡張になり得るため、テスト自動化の費用対効果の高い手法となり得ます。一般に、アサーションの使用はエラー率の低下と相関する[41]が、使い方の違いによって有効性は非常に大きく異なります。多くのアプリケーションでは、アサーションは、ヌルポインターを使用する関数にそれを渡さないことや、除数として使われる可能性のあるパラメーターがゼロでないことを確認するといった、ごく基本的な方法で使われています。
More complex assertions can provide stronger assurance, but there are limits to their effectiveness. For example, invariants (properties that are expected to hold throughout a computation) cannot be assured without placing an assertion for every line of code. Since assertions must be executed to show the presence or absence of a property at some point, errors that prevent the assertion from being reached may not be detected. As an example, consider the code in Figure 26. If a coding error in the first few lines of the function prevents execution the code at of lines 15 and 17, the assertions will not be executed and it may be assumed that the test was passed. In this case, an ERROR return for the particular test case might trigger an investigation that would identify the faulty code, but this may not happen with other applications.
より複雑なアサーションはより強い保証を与えられますが、その有効性には限界があります。例えば、不変条件(計算全体を通じて成立すると期待される性質)は、コードのすべての行にアサーションを置かない限り保証できません。アサーションは、ある時点での性質の有無を示すために実行されなければならないため、アサーションに到達するのを妨げる誤りは検出されない場合があります。例として、図26のコードを考えます。関数の最初の数行にコーディング誤りがあり、15行目と17行目のコードが実行されない場合、アサーションは実行されず、テストに合格したと見なされる可能性があります。この場合、特定のテストケースでERRORが返ることで、欠陥のあるコードを特定する調査が始まるかもしれませんが、他のアプリケーションではそうならないことがあります。
8.4 Chapter Summary
8.4 本章の要約
Assertions are one of the easiest to use and most effective approaches to dealing with the oracle problem. Properties ranging from simple parameter checks to effectively embedded proofs can be encoded in assertions, but special language support is needed for the stronger forms of assurance. This support may be provided as language preprocessors, as in the case of Anna [44] and others. Placement within code is particularly important to assertion effectiveness [60, 61], but if sufficiently strong assertions are embedded, the code becomes self-checking for important properties. With self-checking code, thousands of tests can be run at low cost in most cases, greatly improving the chances that faults will be detected.
アサーションは、オラクル問題に対処する方法のうち、最も使いやすく最も効果的なものの一つです。単純なパラメータ検査から、実質的に埋め込まれた証明に至るまで、さまざまな性質をアサーションとして記述できますが、より強い形の保証には専用の言語サポートが必要です。このサポートは、Anna [44]などの場合のように、言語プリプロセッサとして提供されることがあります。コード内での配置はアサーションの有効性にとって特に重要である[60, 61]が、十分に強いアサーションを埋め込めば、コードは重要な性質について自己検査するようになります。自己検査コードがあれば、ほとんどの場合、数千件のテストを低コストで実行でき、障害が検出される可能性が大幅に高まります。
9 MODEL-BASED TEST ORACLES
9 モデルに基づくテストオラクル
One of the most effective ways to produce test oracles is to use a model of the system under test, and generate complete tests, including both input data and expected results, directly from the model. The model in this case is exactly what the name implies: it incorporates the most important aspects of the system, but not every detail such as the location of an amount on a screen (if it did include all details, it would be equivalent to the system itself). This chapter provides a step-by-step introduction to model-based automated generation of tests that provide combinatorial coverage. Procedures introduced in this tutorial will produce a set of complete tests, i.e., input values with the expected output for each set of inputs.
テストオラクルを作成する最も効果的な方法の一つは、テスト対象システムのモデルを使い、入力データと期待結果の両方を含む完全なテストをモデルから直接生成することです。ここでいうモデルは、まさにその名が示すとおりのものです。すなわち、システムの最も重要な側面を取り込むが、画面上の金額の位置のような細部までは含みません(すべての細部を含むなら、システムそのものと等価になります)。本章では、組合せ網羅を与えるテストのモデルベース自動生成を段階的に紹介します。このチュートリアルで紹介する手順により、完全なテストの集合、すなわち入力値と各入力セットに対する期待出力が生成されます。
In addition to the ACTS covering array generator, (see Appendix C), we use NuSMV [18], a variant of the original SMV model checker. NuSMV is freely available and was developed by Carnegie Mellon University, Instituto per la Ricerca Scientifica e Tecnolgica (IRST), U. of Genova, and U. of Trento. NuSMV can be installed on either UNIX/Linux or Windows systems running Cygwin. Links and instructions for downloading NuSMV are included in the appendix.
ACTSカバリングアレイ生成器(付録C参照)に加えて、元のSMVモデルチェッカーの変種であるNuSMV [18]を使用します。NuSMVは無償で利用でき、Carnegie Mellon University、Instituto per la Ricerca Scientifica e Tecnolgica(IRST)、ジェノヴァ大学、トレント大学が開発しました。NuSMVは、UNIX/Linux、またはCygwinを実行するWindowsシステムにインストールできます。NuSMVをダウンロードするためのリンクと手順は付録に含まれています。
Also needed is a formal or semi-formal specification of the system or subsystem under test (SUT). This can be in the form of a formal logic specification, but state transition tables, decision tables, pseudo-code, or structured natural language can also be used, as long as the rules are unambiguous. The specification will be converted to SMV code, which provides a precise, machine-processable set of rules that can be used to generate tests.
また、テスト対象のシステムまたはサブシステム(SUT)の形式的または半形式的な仕様も必要です。これは形式論理仕様の形でもよいですが、規則が曖昧でない限り、状態遷移表、決定表、擬似コード、構造化自然言語も使用できます。仕様はSMVコードに変換され、テストの生成に使える正確で機械処理可能な規則の集合となります。
9.1 Overview
9.1 概要
To apply combinatorial testing, two tasks must be accomplished:
組合せテストを適用するには、次の2つの作業を行う必要があります。
1.Using ACTS, construct a set of tests that will cover all t-way combinations of parameter values. The covering array specifies test data, where each row of the array can be regarded as a set of parameter values for an individual test (see Chapter 4).
1.ACTSを使い、パラメーター値のすべてのt-way組合せを網羅するテストセットを構築します。被覆配列はテストデータを指定し、配列の各行を個々のテストに用いるパラメーター値の集合とみなせます(第4章参照)。
2.Determine what output should be produced by the SUT for each set of input parameter values. The test data output from ACTS will be incorporated into SMV specifications that can be processed by the NuSMV model checker for this step. In many cases, the conversion to SMV will be straightforward. The example in Section 9.2.1 illustrates a simple conversion of rules in the form “if condition then action” into the syntax used by the model checker. The model checker will instantiate the specification with parameter values from the covering array once for each test in the covering array. The resulting specification is evaluated against a claim that negates each specified result \(R_j\) using a model checker, so that the model checker evaluates claims in the following form: \(C_i \mathrel{=>} {\sim}R_j\), where \(C_i\) is a set of parameter values in one row of the covering array in the form \(p_1 = v_{i1}\) & \(p_2 = v_{i2}\) & ... & \(p_n = v_{in}\), and \(R_j\) is one of the possible results. The output of this step is a set of counterexamples that show how the SUT can reach the claimed result \(R_j\) from a given set of inputs.
2.SUT が入力パラメータ値の各組に対してどのような出力を生成すべきかを決定します。この手順では、ACTS が出力するテストデータを、NuSMV モデル検査器で処理できる SMV 仕様に組み込みます。多くの場合、SMV への変換は簡単です。9.2.1 節の例は、「if condition then action」の形のルールを、モデル検査器で使われる構文へ単純に変換する様子を示しています。モデル検査器は、カバリングアレイ内のテストごとに 1 回ずつ、カバリングアレイのパラメータ値を使って仕様をインスタンス化します。結果として得られる仕様をモデル検査器で評価するため、指定された各結果 \(R_j\) を否定する主張を用います。そのため、モデル検査器は次の形の主張を評価する: \(C_i \mathrel{=>} {\sim}R_j\)。ここで \(C_i\) は、\(p_1 = v_{i1}\) & \(p_2 = v_{i2}\) & ... & \(p_n = v_{in}\) の形で表した、カバリングアレイの 1 行におけるパラメータ値の集合であり、\(R_j\) は取りうる結果の一つです。この手順の出力は、与えられた入力の集合から SUT が主張された結果 \(R_j\) に到達する様子を示す反例の集合です。
The example in the following sections illustrates how these counterexamples are converted into tests. Other approaches to determining the correct output for each test can also be used. For example, in some cases we can run a model checker in simulation mode, producing expected results directly rather than through a counterexample.
以降の節の例では、これらの反例をテストへ変換する方法を示します。各テストの正しい出力を決定するには、他の方法も使えます。たとえば、モデルチェッカーをシミュレーションモードで実行し、反例を介さず期待結果を直接生成できる場合もあります。
The completed tests can be used to validate correct operation of the system for interaction strengths up to some pre-determined level \(t\). Depending on the system type and level of effort, we may want to use pairwise (\(t=2\)) or higher strength, up to \(t=6\) way interactions. We do not claim this guarantees correctness of the system, as there may be failures triggered only by interaction strengths greater than \(t\). In addition, some of the parameters are likely to have a large number of possible values, requiring that they be abstracted into equivalence classes. If the abstraction does not faithfully represent the range of values for a parameter, some flaws may not be detected by equivalence classes used.
完成したテストを使って、あらかじめ定めた水準\(t\)までの相互作用強度について、システムが正しく動作することを検証できます。システムの種類と労力の水準に応じて、ペアワイズ(\(t=2\))またはそれ以上の強度、最大で\(t=6\) wayの相互作用までを使うことが考えられます。\(t\)より大きい相互作用強度でのみ引き起こされる障害があり得るため、これでシステムの正しさが保証されるとは主張しません。加えて、パラメータの一部は取り得る値の数が多いと考えられ、それらを同値クラスへ抽象化する必要があります。抽象化がパラメータの値の範囲を忠実に表していなければ、使用した同値クラスでは一部の欠陥が検出されないことがあります。
9.2 Access Control System Example
9.2 アクセス制御システムの例
Here we present a small example of a very simple access control system. The rules of the system are a simplified multi-level security system, given below, followed by a step-by-step construction of tests using a fully automated process.
ここでは、非常に単純なアクセス制御システムの小さな例を示します。システムの規則は簡略化した多段階セキュリティシステムであり、以下に示します。その後に、全自動のプロセスを用いたテストの構築を段階的に示します。
Each subject (user) has a clearance level \(\mathit{u\_l}\), and each file has a classification level, \(\mathit{f\_l}\). Levels are given as 0, 1, or 2, which could represent levels such as Confidential, Secret, and Top Secret. A user \(u\) can read a file \(\mathrm{f}\) if \(\mathit{u\_l} \ge \mathit{f\_l}\) (the “no read up” rule), or write to a file if \(\mathit{f\_l} \ge \mathit{u\_l}\) (the “no write down” rule).
各主体(利用者)にはクリアランスレベル\(\mathit{u\_l}\)があり、各ファイルには分類レベル\(\mathit{f\_l}\)があります。レベルは0、1、2のいずれかで与えられ、Confidential、Secret、Top Secretなどのレベルを表し得ます。利用者\(u\)がファイル\(\mathrm{f}\)を読み取れるのは\(\mathit{u\_l} \ge \mathit{f\_l}\)の場合(「no read up」規則)であり、ファイルに書き込めるのは\(\mathit{f\_l} \ge \mathit{u\_l}\)の場合(「no write down」規則)です。
Thus a pseudo-code representation of the access control rules is:
したがって、アクセス制御ルールの擬似コードによる表現は次のとおりです。
if u_l >= f_l & act = rd then GRANT;
else if f_l >= u_l & act = wr then GRANT;
else DENY;Tests produced will check that these rules are correctly implemented in a system.
生成されたテストで、システムにおいてこれらの規則が正しく実装されていることを確認します。
9.2.1 SMV Model
9.2.1 SMVモデル
This system is easily modeled in SMV as a simple two-state finite state machine. The START state merely initializes the system (line 8, Figure 27), with the rule above used to evaluate access as either GRANT or DENY (lines 9-13). For example, line 9 represents the first line of the pseudo-code above: in the current state (always START for this simple model), if u_l ≥ f_l then the next state is GRANT. Each line of the case statement is examined sequentially, as in a conventional programming language. Line 12 implements the “else DENY” rule, since the predicate “1” is always true. SPEC clauses given at the end of the model are simple “reflections” that duplicate the access control rules as temporal logic statements. They are thus trivially provable, but we are interested in using them to generate tests rather than to prove properties of the system.
このシステムは、SMV で単純な 2 状態の有限状態機械として容易にモデル化できます。START 状態は、システムを初期化するだけであり(図 27 の 8 行目)、上記のルールを用いて、アクセスを GRANT または DENY のいずれかとして評価します(9〜13 行目)。例えば、9 行目は上記の擬似コードの最初の行を表しています。現在の状態(この単純なモデルでは常に START)で u_l ≥ f_l ならば、次の状態は GRANT です。case 文の各行は、従来のプログラミング言語と同様に、順に調べられます。12 行目は、述語「1」が常に真であるため、「else DENY」ルールを実装しています。モデルの末尾にある SPEC 節は、アクセス制御ルールを時相論理の文として複製した、単純な「反映」です。したがって、それらは自明に証明可能ですが、ここではシステムの性質を証明するのではなく、それらを使ってテストを生成することに関心があります。
1.     MODULE main
2.     VAR
--Input parameters
3.     u_l:   0..2;        -- user level
4.     f_l:   0..2;        -- file level
5.     act:  {rd,wr};      -- action

--output parameter
6.     access: {START_, GRANT,DENY};

7.     ASSIGN
8.     init(access) := START_;
--if access is allowed under rules, then next state is GRANT
--else next state is DENY
9.     next(access) := case
10.    u_l >= f_l & act = rd : GRANT;
11.    f_l >= u_l & act = wr : GRANT;
12.    1 : DENY;
13.    esac;
14.    next(u_l) := u_l;
15.    next(f_l) := f_l;
16.    next(act) := act;

-- if user level is at or above file level then read is OK
SPEC AG ((u_l >= f_l & act = rd ) -> AX (access = GRANT));

-- if user level is at or below file level, then write is OK
SPEC AG ((f_l >= u_l & act = wr ) -> AX (access = GRANT));

-- if neither condition above is true, then DENY any action
SPEC AG (!( (u_l >= f_l & act = rd ) | (f_l >= u_l & act = wr ))
-> AX (access = DENY));Figure 27. SMV model of access control rules
図27. アクセス制御規則のSMVモデル。
Separate documentation on SMV should be consulted to fully understand the syntax used, but specifications of the form “AG ((predicate 1) -> AX (predicate 2))” indicate essentially that for all paths (the “A” in “AG”) for all states globally (the “G”), if predicate 1 holds then ( “->”) for all paths, in the next state (the “X” in “AX”) predicate 2 will hold. In the next section we will see how this specification can be used to produce complete tests, with test data input and the expected output for each set of input data.
SMV の構文を完全に理解するには別途資料を参照すべきですが、「AG ((predicate 1) -> AX (predicate 2))」形式の仕様は、基本的に、すべての経路(「AG」の「A」)について、大域的にすべての状態で(「G」)、述語 1 が成立すれば(「->」)、すべての経路で次状態(「AX」の「X」)に述語 2 が成立することを示します。次節では、この仕様を使って、入力テストデータと各入力データセットに対する期待される出力を含む完全なテストを作成する方法を説明します。
Model checkers can be used to perform a variety of valuable functions, because they make it possible to evaluate whether certain properties are true of the system model. Conceptually, the model checker can be viewed as exploring all states of a system model to determine if a property claimed in a SPEC statement is true. If the statement can be proved true for the given model, the model checker reports this fact. What makes a model checker particularly valuable for many applications, though, is that if the statement is false, the model checker not only reports this, but also provides a “counterexample” showing how the claim in the SPEC statement can be shown false. The counterexample will include input data values and a trace of system states that lead to a result contrary to the SPEC claim (Figure 28). In the process described in this section, the input data values will be the covering array generated by ACTS.
モデルチェッカーは、システムモデル上で特定の性質が成立するかどうかを評価できるため、さまざまな有用な機能を実行できます。概念的には、モデルチェッカーはシステムモデルの全状態を調べ、SPEC文で主張された性質が真かどうかを判定するものと考えられます。所与のモデルで文が真と証明できれば、その事実を報告します。しかし、多くの用途でモデルチェッカーが特に有用なのは、文が偽の場合、その事実を報告するだけでなく、SPEC文の主張が偽となる方法を示す「反例」も提示する点です。反例には、入力データ値と、SPECの主張に反する結果に至るシステム状態のトレースが含まれます(図28)。本節で説明する手順では、入力データ値にACTSが生成したカバリングアレイを用います。
For advanced uses in test generation, this counterexample generation capability is very useful for proving properties such as liveness (absence of deadlock) that are difficult to ensure through testing. In this tutorial, however, we will simply use the model checker to determine whether a particular input data set makes a SPEC claim true or false. That is, we will enter claims that particular results can be reached for a given set of input data values, and the model checker will tell us if the claim is true or false. This gives us the ability to match every set of input test data with the result that the system should produce for that input data.
テスト生成における高度な用途では、この反例生成機能は、テストでは保証しにくい活性(デッドロックがないこと)などの性質を証明するうえで非常に有用です。ただしこのチュートリアルでは、特定の入力データセットがSPECの主張を真にするか偽にするかを判定するためだけにモデルチェッカーを使います。すなわち、与えられた入力データ値の集合に対して特定の結果に到達できるという主張を入力し、その主張が真か偽かをモデルチェッカーに判定させます。これにより、入力テストデータのすべての集合を、その入力データに対してシステムが生成すべき結果と対応付けられます。
The model checker thus automates the work that normally must be done by a human tester – determining what the correct output should be for each set of input data. In some cases, we may have a “reference implementation”, that is, an implementation of the functions that we are testing that is assumed to be correct. This happens, for example, in conformance testing for protocols, where many vendors implement their own software for the protocol and submit it to a test lab for comparison with an existing implementation of the protocol. In this case the reference implementation could be used for determining the expected output, instead of the model checker. Of course before this can happen the reference implementation itself must be thoroughly tested before it can be used as the gold standard for testing other products, so the method we describe here may be needed to produce tests for the original reference implementation.
このようにモデルチェッカーは、通常は人間のテスターが行わなければならない作業、すなわち各入力データセットに対する正しい出力が何であるかを決める作業を自動化します。場合によっては「参照実装」、すなわちテスト対象の機能の実装のうち正しいと仮定されるものが存在します。これはたとえばプロトコルの適合性試験で生じます。そこでは多くのベンダーがプロトコルの独自ソフトウェアを実装し、プロトコルの既存実装と比較するために試験機関へ提出します。この場合、モデルチェッカーの代わりに参照実装を使って期待出力を決定できます。もちろんその前に、他の製品をテストするためのゴールドスタンダードとして使えるよう、参照実装そのものを徹底的にテストしなければなりません。したがって、元の参照実装のテストを生成するために、ここで述べる方法が必要になる場合があります。
Checking the properties in the SPEC statements shows that they match the access control rules as implemented in the FSM, as expected. In other words, the claims we made about the state machine in the SPEC clauses can be proven. This step is used to check that the SPEC claims are valid for the model defined previously. If NuSMV is unable to prove one of the SPECs, then either the spec or the model is incorrect. This problem must be resolved before continuing with the test generation process. Once the model is correct and SPEC claims have been shown valid for the model, counterexamples can be produced that will be turned into test cases, by which we mean a set of test inputs with the expected result for these inputs. In other words, ACTS is used to generate tests, then the model checker determines expected results for each test.
SPEC文の性質を検査すると、予想どおり、FSMに実装されたアクセス制御規則と一致することが分かります。言い換えれば、SPEC節で状態機械について行った主張は証明できます。この手順は、先に定義したモデルに対してSPECの主張が妥当であることを確認するために用います。NuSMVがSPECのいずれかを証明できなければ、仕様かモデルのどちらかが誤っています。この問題は、テスト生成プロセスを続ける前に解決しなければなりません。モデルが正しく、SPECの主張がモデルに対して妥当であると示されれば、反例を生成でき、それがテストケースに変換されます。ここでいうテストケースとは、テスト入力の集合とその入力に対する期待結果のことです。言い換えれば、ACTSを使ってテストを生成し、その後モデルチェッカーが各テストの期待結果を決定します。
-- specification AG((u_l >= f_l & act = rd) -> AX access = GRANT)
     is true
-- specification AG((f_l >= u_l & act = wr) -> AX access = GRANT)
     is true
-- specification AG(!((u_l >= f_l & act = rd)|(f_l >= u_l & act = wr))
-> AX access = DENY) is trueFigure 28. NuSMV output
図28. NuSMVの出力
9.2.2 Integrating Combinatorial Tests into the Model
9.2.2 組合せテストのモデルへの統合
We will compute covering arrays that give all \(t\)-way combinations, with degree of interaction coverage = 2 for this example. This section describes the use of ACTS as a standalone command line tool, using a text file input (see Section 3.1). The first step is to define the parameters and their values in a system definition file that will be used as input to ACTS. Call this file “in.txt”, with the following format:
すべての\(t\)-way組合せを与えるカバリングアレイを計算します。この例では相互作用網羅の次数 = 2とします。本節では、テキストファイル入力(第3.1節参照)を用い、ACTSを単独のコマンドラインツールとして使う方法を説明します。最初の手順は、ACTSへの入力として使うシステム定義ファイルに、パラメータとその値を定義することです。このファイルを「in.txt」と呼び、形式は次のとおりとする:
[System] [Parameter] u_l: 0,1,2 f_l: 0,1,2 act: rd,wr [Relation] [Constraint] [Misc]
[System] [Parameter] u_l: 0,1,2 f_l: 0,1,2 act: rd,wr [Relation] [Constraint] [Misc]
For this application, the [Parameter] section of the file is all that is needed. Other tags refer to advanced functions that will be explained in other documents. After the system definition file is saved, run ACTS as shown below: java -Ddoi=2 –jar acts_cmd.jar ActsConsoleManager in.txt out.txt
このアプリケーションでは、ファイルの[Parameter]セクションだけが必要です。その他のタグは、別の文書で説明する高度な機能に関するものです。システム定義ファイルを保存した後、次のようにACTSを実行する:java -Ddoi=2 –jar acts_cmd.jar ActsConsoleManager in.txt out.txt
The “-Ddoi=2” argument sets the degree of interaction for the covering array that we want ACTS to compute. In this case we are using simple 2-way, or pairwise, interactions. (For a system with more parameters we would use a higher strength interaction, but with only three parameters, 3-way interaction would be equivalent to exhaustive testing.) ACTS produces the output shown in Figure 29.
「-Ddoi=2」引数は、ACTSに計算させるカバリングアレイの相互作用次数を設定します。この例では単純な2-way(ペアワイズ)相互作用を使います。より多くのパラメータを持つシステムなら、より高い相互作用強度を使いますが、パラメータが3つだけのシステムでは3-way相互作用は全数テストと同等になります。ACTSは図29に示す出力を生成します。
Each test configuration defines a set of values for the input parameters \(\mathrm{u\_l}\), \(\mathrm{f\_l}\), and \(\mathrm{act}\). The complete test set ensures that all 2-way combinations of parameter values have been covered. If we had a larger number of parameters, we could produce test configurations that cover all 3-way, 4-way, etc. combinations. ACTS may output “don’t care” for some parameter values. This means that any legitimate value for that parameter can be used and the full set of configurations will still cover all \(\mathrm{t}\)-way combinations. Since “don’t care” is not normally an acceptable input for programs being tested, a random value for that parameter is substituted before using the covering array to produce tests.
各テスト構成は、入力パラメータ\(\mathrm{u\_l}\)、\(\mathrm{f\_l}\)、\(\mathrm{act}\)の値の集合を定めます。完全なテストセットにより、パラメータ値のすべての2-way組合せが網羅されることが保証されます。パラメータの数がもっと多ければ、すべての3-way、4-wayなどの組合せを網羅するテスト構成を生成できます。ACTSは一部のパラメータ値に「don’t care」を出力することがあります。これは、そのパラメータには正当な値であればどれを使ってもよく、それでも構成の全体がすべての\(\mathrm{t}\)-way組合せを網羅することを意味します。「don’t care」は通常、テスト対象プログラムへの入力として受け入れられないため、カバリングアレイを使ってテストを生成する前に、そのパラメータにはランダムな値を代入します。
The next step is to assign values from the covering array to parameters used in the model. For each test, we claim that the expected result will not occur. The model checker determines combinations that would disprove these claims, outputting these as counterexamples. Each counterexample can then be converted to a test with known expected result. Every test from the ACTS tool is used, with the model checker supplying expected results for each test. (Note that the trivially provable positive claims have been commented out. Here we are concerned with producing counterexamples.)
次のステップは、被覆配列の値を、モデルで使うパラメータに割り当てることです。各テストについて、期待される結果は発生しないと主張します。モデル検査器は、これらの主張を反証する組合せを判定し、それらを反例として出力します。その後、各反例を、期待結果が既知のテストに変換できます。ACTSツールから得たすべてのテストを使用し、モデル検査器が各テストの期待結果を与えます。(自明に証明できる肯定的な主張はコメントアウトしている点に注意されました。ここで関心があるのは反例の生成です。)
Recall the structure introduced in Section 9.1: Ci => ~Rj. Here Ci is the set of parameter values from the covering array. For example, for configuration #1 in Section:
9.1節で導入した構造 Ci => ~Rj を思い出されました。ここでCiは被覆配列から得たパラメータ値の集合です。たとえば、節の構成#1については次のようになります。
u_l = 0 & f_l = 0 & act = rd
u_l = 0 & f_l = 0 & act = rd
As can be seen below, for each of the 9 configurations in the covering array we create a SPEC claim of the form:
以下に示すとおり、カバリングアレイの9個の構成それぞれについて、次の形式のSPEC主張を作成する:
SPEC AG(( <covering array values> ) -> AX !(access = <result>));
SPEC AG(( <covering array values> ) -> AX !(access = <result>));
This process is repeated for each possible result, in this case either “GRANT” or “DENY”, so we have 9 claims for each of the two results. The model checker is able to determine, using the model defined in Section 9.2.1, which result is the correct one for each set of input values, producing a total of 9 tests.
この手順を、取り得る結果のそれぞれ(この場合は「GRANT」または「DENY」)について繰り返すので、二つの結果のそれぞれに対して9個の主張が得られます。モデルチェッカーは、第9.2.1節で定義したモデルを使って、各入力値の集合に対してどちらの結果が正しいかを判定でき、合計9件のテストが生成されます。
Excerpt: ... -- reflection of the assign for access --SPEC AG ((u_l >= f_l & act = rd ) -> AX (access = GRANT)); --SPEC AG ((f_l >= u_l & act = wr ) -> AX (access = GRANT)); --SPEC AG (!((u_l >= f_l & act = rd ) | (f_l >= u_l & act = wr )) -> AX (access = DENY));
Excerpt: ... -- reflection of the assign for access --SPEC AG ((u_l >= f_l & act = rd ) -> AX (access = GRANT)); --SPEC AG ((f_l >= u_l & act = wr ) -> AX (access = GRANT)); --SPEC AG (!((u_l >= f_l & act = rd ) | (f_l >= u_l & act = wr )) -> AX (access = DENY));
SPEC AG((u_l = 0 & f_l = 0 & act = rd) -> AX !(access = GRANT)); SPEC AG((u_l = 0 & f_l = 1 & act = wr) -> AX !(access = GRANT)); SPEC AG((u_l = 0 & f_l = 2 & act = rd) -> AX !(access = GRANT)); SPEC AG((u_l = 1 & f_l = 0 & act = wr) -> AX !(access = GRANT)); SPEC AG((u_l = 1 & f_l = 1 & act = rd) -> AX !(access = GRANT)); SPEC AG((u_l = 1 & f_l = 2 & act = wr) -> AX !(access = GRANT)); SPEC AG((u_l = 2 & f_l = 0 & act = rd) -> AX !(access = GRANT)); SPEC AG((u_l = 2 & f_l = 1 & act = wr) -> AX !(access = GRANT)); SPEC AG((u_l = 2 & f_l = 2 & act = rd) -> AX !(access = GRANT));
SPEC AG((u_l = 0 & f_l = 0 & act = rd) -> AX !(access = GRANT)); SPEC AG((u_l = 0 & f_l = 1 & act = wr) -> AX !(access = GRANT)); SPEC AG((u_l = 0 & f_l = 2 & act = rd) -> AX !(access = GRANT)); SPEC AG((u_l = 1 & f_l = 0 & act = wr) -> AX !(access = GRANT)); SPEC AG((u_l = 1 & f_l = 1 & act = rd) -> AX !(access = GRANT)); SPEC AG((u_l = 1 & f_l = 2 & act = wr) -> AX !(access = GRANT)); SPEC AG((u_l = 2 & f_l = 0 & act = rd) -> AX !(access = GRANT)); SPEC AG((u_l = 2 & f_l = 1 & act = wr) -> AX !(access = GRANT)); SPEC AG((u_l = 2 & f_l = 2 & act = rd) -> AX !(access = GRANT));
SPEC AG((u_l = 0 & f_l = 0 & act = rd) -> AX !(access = DENY)); SPEC AG((u_l = 0 & f_l = 1 & act = wr) -> AX !(access = DENY)); SPEC AG((u_l = 0 & f_l = 2 & act = rd) -> AX !(access = DENY)); SPEC AG((u_l = 1 & f_l = 0 & act = wr) -> AX !(access = DENY)); SPEC AG((u_l = 1 & f_l = 1 & act = rd) -> AX !(access = DENY)); SPEC AG((u_l = 1 & f_l = 2 & act = wr) -> AX !(access = DENY)); SPEC AG((u_l = 2 & f_l = 0 & act = rd) -> AX !(access = DENY)); SPEC AG((u_l = 2 & f_l = 1 & act = wr) -> AX !(access = DENY)); SPEC AG((u_l = 2 & f_l = 2 & act = rd) -> AX !(access = DENY));
SPEC AG((u_l = 0 & f_l = 0 & act = rd) -> AX !(access = DENY)); SPEC AG((u_l = 0 & f_l = 1 & act = wr) -> AX !(access = DENY)); SPEC AG((u_l = 0 & f_l = 2 & act = rd) -> AX !(access = DENY)); SPEC AG((u_l = 1 & f_l = 0 & act = wr) -> AX !(access = DENY)); SPEC AG((u_l = 1 & f_l = 1 & act = rd) -> AX !(access = DENY)); SPEC AG((u_l = 1 & f_l = 2 & act = wr) -> AX !(access = DENY)); SPEC AG((u_l = 2 & f_l = 0 & act = rd) -> AX !(access = DENY)); SPEC AG((u_l = 2 & f_l = 1 & act = wr) -> AX !(access = DENY)); SPEC AG((u_l = 2 & f_l = 2 & act = rd) -> AX !(access = DENY));
9.2.3 Generating Tests from Counterexamples
9.2.3 反例からのテスト生成
NuSMV produces counterexamples where the input values would disprove the claims specified in the previous section. Each of these counterexamples is thus a set of test data that would have the expected result of GRANT or DENY.
NuSMVは、入力値が前節で指定した主張を反証する場合に反例を生成します。したがって、これらの反例はそれぞれ、期待結果がGRANTまたはDENYとなるテストデータの集合です。
For each SPEC claim, if this set of values cannot in fact lead to the particular result Rj, the model checker indicates that this is true. For example, for the configuration below, the claim that access will not be granted is true, because the user’s clearance level (u_l = 0) is below the file’s level (f_l = 2):
各 SPEC 主張について、この値の組が実際には特定の結果 Rj に至りえない場合、モデル検査器はそれが真であることを示します。たとえば、次の構成では、利用者のクリアランスレベル(u_l = 0)がファイルのレベル(f_l = 2)より低いため、アクセスが許可されないという主張は真です。
-- specification AG (((u_l = 0 & f_l = 2) & act = rd) -> AX !(access = GRANT)) is true
-- specification AG (((u_l = 0 & f_l = 2) & act = rd) -> AX !(access = GRANT)) is true
If the claim is false, the model checker indicates this and provides a trace of parameter input values and states that will prove it is false. In effect this is a complete test case, i.e., a set of parameter values and expected result. It is then simple to map these values into complete test cases in the syntax needed for the system under test.
主張が偽であれば、モデルチェッカーはその旨を示し、偽であることを証明するパラメータ入力値と状態のトレースを提供します。これは実質的に完全なテストケース、すなわちパラメータ値と期待結果の集合です。その後、これらの値を、テスト対象システムに必要な構文の完全なテストケースへ対応付けるのは簡単です。
Excerpt from NuSMV output:
NuSMV出力の抜粋:
-- specification AG (((u_l = 0 & f_l = 0) & act = rd) -> AX access = GRANT)) is false -- as demonstrated by the following execution sequence Trace Description: CTL Counterexample Trace Type: Counterexample -> State: 1.1 <- u_l = 0 f_l = 0 act = rd access = START_ -> Input: 1.2 <- -> State: 1.2 <- access = GRANT
-- specification AG (((u_l = 0 & f_l = 0) & act = rd) -> AX access = GRANT)) is false -- as demonstrated by the following execution sequence Trace Description: CTL Counterexample Trace Type: Counterexample -> State: 1.1 <- u_l = 0 f_l = 0 act = rd access = START_ -> Input: 1.2 <- -> State: 1.2 <- access = GRANT
The model checker finds that 6 of the input parameter configurations produce a result of GRANT and 3 produce a DENY result, so at the completion of this step we have successfully matched up each input parameter configuration with the result that should be produced by the SUT.
モデルチェッカーは、入力パラメーター構成のうち6つがGRANTの結果を、3つがDENYの結果を生成することを見いだします。したがって、このステップの完了時には、各入力パラメーター構成を、SUTが生成すべき結果と対応付けることに成功しています。
We now strip out the parameter names and values, giving tests that can be applied to the system under test. This can be accomplished using a variety of methods; a simple script used in this example is given in the appendix. The test inputs and expected results produced are shown below:
次に、パラメータ名と値の表記を取り除き、テスト対象システムに適用できるテストにします。これにはさまざまな方法があり、この例で使用した簡単なスクリプトを付録に示します。生成されたテスト入力と期待結果を以下に示す:
u_l = 0 & f_l = 0 & act = rd -> access = GRANT u_l = 0 & f_l = 1 & act = wr -> access = GRANT u_l = 1 & f_l = 1 & act = rd -> access = GRANT u_l = 1 & f_l = 2 & act = wr -> access = GRANT u_l = 2 & f_l = 0 & act = rd -> access = GRANT u_l = 2 & f_l = 2 & act = rd -> access = GRANT u_l = 0 & f_l = 2 & act = rd -> access = DENY u_l = 1 & f_l = 0 & act = wr -> access = DENY u_l = 2 & f_l = 1 & act = wr -> access = DENY
u_l = 0 & f_l = 0 & act = rd -> access = GRANT u_l = 0 & f_l = 1 & act = wr -> access = GRANT u_l = 1 & f_l = 1 & act = rd -> access = GRANT u_l = 1 & f_l = 2 & act = wr -> access = GRANT u_l = 2 & f_l = 0 & act = rd -> access = GRANT u_l = 2 & f_l = 2 & act = rd -> access = GRANT u_l = 0 & f_l = 2 & act = rd -> access = DENY u_l = 1 & f_l = 0 & act = wr -> access = DENY u_l = 2 & f_l = 1 & act = wr -> access = DENY
These test definitions can now be post-processed using simple scripts written in PERL, Python, or similar tool to produce a test harness that will execute the SUT with each input and check the results. While tests for this trivial example could easily have been constructed manually, the procedures introduced in this tutorial can, and have, been used to produce tens of thousands of complete test cases in a few minutes, once the SMV model has been defined for the SUT.
これらのテスト定義は、PERL、Pythonまたは同様のツールで書いた簡単なスクリプトで後処理することにより、各入力でSUTを実行して結果を確認するテストハーネスにできます。この自明な例のテストは手作業でも容易に構築できましたが、SUT用のSMVモデルをいったん定義すれば、このチュートリアルで紹介した手順により、数分で数万件の完全なテストケースを生成することができるし、実際に生成してきました。
9.3 Cost and Practical Considerations
9.3 コストと実務上の考慮事項
Model based test generation trades up-front analysis and specification time against the cost of greater human interaction for analyzing test results. The model or formal specification may be costly to produce, but once it is available, large numbers of tests can be generated, executed, and analyzed without human intervention. This can be an enormous cost savings, since testing usually requires 50% or more of the software development budget. For example, suppose a $100,000 development project expects to spend $50,000 on testing, because of the staff time required to code and run tests, and analyze results. If a formal model can be created for $20,000, complete tests generated and analyzed automatically, with another $10,000 for a smaller number of human-involved tests and analysis, then the project will save 20%. One tradeoff for this savings is the requirement for staff with skills in formal methods, but in some cases this approach may be practical and highly cost-effective.
モデルベースのテスト生成では、事前の分析と仕様化に時間をかける代わりに、テスト結果の分析に人手を多く要するコストを抑えます。モデルまたは形式仕様の作成には費用がかかる場合がありますが、いったん用意できれば、大量のテストを人手を介さずに生成、実行、分析できます。テストには通常、ソフトウェア開発予算の50%以上が必要となるため、これは大幅なコスト削減になり得ます。例えば、テストのコーディングと実行、結果の分析に要する要員の工数のために、開発費10万ドルのプロジェクトでテストに5万ドルを費やすと見込まれるとします。形式モデルを2万ドルで作成でき、完全なテストが自動的に生成・分析され、人手が関与する少数のテストと分析にさらに1万ドルかかるなら、プロジェクトは20%を節約できます。この節約に伴うトレードオフの1つは、形式手法の技能を持つ要員が必要になることですが、場合によってはこの手法は実用的であり、費用対効果に非常に優れています。
9.4 Chapter Summary
9.4 本章のまとめ
1.The oracle problem must be solved for any test methodology, and it is particularly important for thorough testing that produces a large number of test cases. One approach to determining expected results for each test input is to use a model of the system that can be simulated or analyzed to compute output for each input.
1.オラクル問題はどのようなテスト手法でも解決しなければならず、多数のテストケースを生成する徹底的なテストでは特に重要です。各テスト入力に対する期待結果を決定する方法の一つは、シミュレーションまたは解析によって各入力に対する出力を計算できるシステムのモデルを使うことです。
2.Model checkers can be used to solve the oracle problem because whenever a specified property for a model does not hold, the model checker generates a counter-example. The counter-example can be post-processed into a complete working test harness that executes all tests from the covering array and checks results.
2.モデルチェッカーはオラクル問題の解決に使えます。モデルに対して指定された性質が成り立たない場合は必ず、モデルチェッカーが反例を生成するためです。この反例を後処理することで、被覆配列のすべてのテストを実行し結果を検査する、完全に動作するテストハーネスにできます。
3.Several approaches are possible for integrating combinatorial testing with model checkers, but some present practical problems. The method reported in this chapter can be used to generate full combinatorial test suites, with expected results for each test, in a cost effective way.
3.組合せテストをモデルチェッカーと統合する方法はいくつか考えられますが、実務上の問題を伴うものもあります。本章で報告した方法を使えば、各テストの期待結果を伴う完全な組合せテストスイートを、費用対効果の高い方法で生成できます。
10 FAULT LOCALIZATION
10 障害箇所の特定
Developing dependable software requires preventing as many bugs as possible and detecting, then repairing, those that remain. Testing can identify flaws in software, but after a failed test is discovered, it is necessary to determine what caused the failure. In most cases this may be accomplished for combinatorial testing in the same way as other test methodologies, using a debugger or in-circuit emulator. But one goal of combinatorial testing is to identify the particular t-way combination that triggered a failure. The problem of fault localization, identifying such combination(s), is an area of active research, but some basic approaches can be identified. The discussion in this chapter assumes systems are deterministic, such that a particular input always generates the same output.
信頼できるソフトウェアを開発するには、できるだけ多くのバグを防ぎ、残ったバグを検出して修正する必要があります。テストによってソフトウェアの欠陥を特定できますが、失敗したテストが見つかった後は、何が障害の原因となったかを突き止める必要があります。多くの場合、組合せテストでもこれは他のテスト手法と同じように、デバッガやインサーキットエミュレータを用いて行えます。しかし、組合せテストの目的の一つは、障害を引き起こした特定の t 項組合せを特定することです。そのような組合せを特定する障害箇所の特定の問題は活発に研究されている分野ですが、いくつかの基本的な手法を挙げることができます。本章の議論では、システムは決定的であり、特定の入力が常に同じ出力を生成すると仮定します。
At first glance, fault localization may not appear to be a difficult problem, and in many cases it will not be, but we want to automate the process as much as possible. To understand the size of the problem, consider a module that has 20 input parameters. A set of 3-way covering tests passes 100%, but several tests derived from a 4-way covering array result in failure. (Therefore, at least four parameter values are involved in triggering the failure. It is possible that a 5-way or higher combination caused the failure, since any set of t-way tests also includes (t+1)-way and higher strength combinations as well.) A test with 20 input parameters has C(20, 4) = 4,845 4-way combinations, yet presumably only one (or just a few) of these triggered the failure. To determine the combination at fault, a variety of strategies can be used.
一見すると、障害箇所の特定は難しい問題には見えないかもしれず、実際多くの場合は難しくありませんが、このプロセスはできるだけ自動化しました。問題の規模を理解するために、20個の入力パラメータを持つモジュールを考えます。3項カバリングテストのセットはすべて合格しますが、4項カバリング配列から導出したいくつかのテストが失敗する(したがって、障害の発生には少なくとも4つのパラメータ値が関与しています。t 項テストのセットは (t+1) 項以上の強度の組合せも含むため、5項以上の組合せが障害を引き起こした可能性もあります)。20個の入力パラメータを持つテストには C(20, 4) = 4,845 個の4項組合せがありますが、そのうち障害を引き起こしたのはおそらく1つ(またはごく少数)だけです。障害の原因となった組合せを特定するには、さまざまな戦略を用いることができます。
10.1 Set-theoretic Analysis
10.1 集合論的分析
The analysis presented here applies to a deterministic system, in which a particular set of input values always results in the same processing and outputs. Let P = {combinations in passing tests} and F = {combinations in failing tests} and C = {fault-triggering combinations}. Then F \ P , combinations in failing tests that are not in any passing tests, must contain the fault-triggering combinations C because if any of those in C were in P, then the test would have failed. So in most cases, C ⊆ F \ P , as shown in Figure 30.
ここで示す分析は、特定の入力値の組が常に同じ処理と出力をもたらす決定的なシステムに適用されます。P = {合格したテスト中の組合せ}、F = {失敗したテスト中の組合せ}、C = {障害を引き起こす組合せ} とします。このとき、F \ P 、すなわち失敗したテストに含まれ、どの合格したテストにも含まれない組合せは、障害を引き起こす組合せ C を含んでいなければなりません。C の組合せのいずれかが P に含まれていたとすれば、そのテストは失敗していたはずだからです。したがって、ほとんどの場合、図30に示すように C ⊆ F \ P となります。
Figure 30. Combinations in failing tests but not in passing tests.
原文のみ
Continuing with the analysis in this manner, some properties become apparent. For the discussion below, \(Pt\) = {combinations in \(t\)-way passing tests}, with \(Ft\) and \(Ct\) defined analogously. Let \(Tt\) = {\(t\)-way tests} and \(f(x)\) be a function that indicates whether a test \(x\) passes or fails for the system under test. Thus \(P4\) = {combinations in 4-way passing tests}, \(T5\)= {5-way tests}, etc.
このように分析を続けると、いくつかの性質が明らかになります。以下の議論では、\(Pt\) = {\(t\)-wayの合格テストに含まれる組合せ}とし、\(Ft\)と\(Ct\)も同様に定義します。\(Tt\) = {\(t\)-wayテスト}とし、\(f(x)\)を、テスト\(x\)が試験対象システムで合格するか失敗するかを示す関数とします。したがって、\(P4\) = {4-wayの合格テストに含まれる組合せ}、\(T5\)= {5-wayテスト}などとなります。
Suppose that a particular combination \(c\) triggers or causes a failure if whenever \(c\) is contained in some test \(x\), \(f(x) = \mathit{fail}\). (That is, the system is deterministic and the failure-triggering combination is not masked by other parameter values.) We can now consolidate these ideas into heuristics for identifying the failure-triggering combination(s) \(C\).
ある組合せ\(c\)は、\(c\)を含むテスト\(x\)で常に\(f(x) = \mathit{fail}\)となるとき、失敗を誘発する、または失敗の原因であるとします。(すなわち、システムは決定論的であり、失敗誘発組合せが他のパラメーター値によって覆い隠されることはありません。)これらの考えをまとめ、失敗誘発組合せ\(C\)を特定するためのヒューリスティックを示します。
•Elimination: For a deterministic system, F \ P must contain the fault-triggering combinations C because if any of those in C were in P, then the test would have failed.
•消去:決定論的システムでは、F \ P は故障を引き起こす組合せ C を含まなければなりません。C のいずれかが P に含まれていたなら、そのテストは失敗していたはずだからです。
• Interaction level lower bound: If all \(t\)-way tests pass, then a \(t\)-way or lower strength combination did not cause the failure. The failure must have been caused by a \((t+k)\)-way combination, for some \(k > t\). Note that the converse is not necessarily true: if some \(t\)-way test fails, we cannot conclude that a \(t\)-way test caused the failure, because any \(t\)-way test set contains some \(k\)-way combinations, for \(k > t\).
• 相互作用レベルの下限:すべての\(t\)-wayテストが合格した場合、\(t\)-way以下の強度の組合せが失敗を引き起こしたのではありません。失敗は、\((t+k)\)-way組合せ(ある\(k > t\)について)が引き起こしたはずです。ただし逆は必ずしも成り立たない点に注意します。ある\(t\)-wayテストが失敗しても、\(t\)-wayテストが失敗を引き起こしたと結論することはできません。任意の\(t\)-wayテスト集合には、\(k\)-way組合せ(\(k > t\))も含まれるためです。
• Interaction continuity: Now consider \(Ct\). Because \(t\)-way tests cover all combinations of \(t\)-way or lower strength (e.g., 4-way tests also cover all 3-way combinations), a combination that triggered the failure in \(Ft\) must also occur in \(F(t+1)\), \(F(t+2)\), etc. Therefore we can further reduce the potential failure-triggering combinations by computing \(Ft \cap F(t+1) \cap \ldots \cap F(t+k)\) for whatever interaction strength \(k\) we have tests available.
• 相互作用の連続性:次に\(Ct\)を考えます。\(t\)-wayテストは\(t\)-way以下の強度のすべての組合せを網羅する(たとえば4-wayテストはすべての3-way組合せも網羅する)ため、\(Ft\)で失敗を引き起こした組合せは\(F(t+1)\)、\(F(t+2)\)などにも現れるはずです。したがって、\(Ft \cap F(t+1) \cap \ldots \cap F(t+k)\)を、テストが利用できる任意の相互作用強度\(k\)について計算することで、失敗を誘発する可能性のある組合せをさらに絞り込めます。
•Value dependence: If tests in Ft cover all values for a t-way parameter combination c, then the failure is independent of c; i.e., c is not a t-way failure-triggering combination(s).
•値への依存性:Ftのテストが、あるt-wayパラメーター組合せcのすべての値を網羅している場合、失敗はcに依存しません。つまり、cはt-wayの失敗誘発組合せではありません。
Example: In the preceding discussion we assumed that a particular combination \(c\) triggers or causes a failure if whenever \(c\) is contained in some test \(x\), \(f(x) = \mathit{fail}\). However, in many cases the presence of a particular combination may trigger a failure, but is not guaranteed to do so (see discussion of interaction level lower bound above). Consider the following:
例:ここまでの議論では、ある組合せ\(c\)は、\(c\)を含むテスト\(x\)で常に\(f(x) = \mathit{fail}\)となるとき、失敗を誘発する、または失敗の原因であると仮定しました。しかし多くの場合、ある組合せが存在すると失敗が起こり得るものの、必ず起こるとは限りません(前述の相互作用レベルの下限についての議論を参照)。次の例を考えます。
1.p(int a, int b, int c, int d, int e) {
1.p(int a, int b, int c, int d, int e) {
2.if (a && b) return 1;
2.if (a && b) return 1;
3.else if (c && d) return 2;
3.else if (c && d) return 2;
4.else if (e) return 3;
4.else if (e) return 3;
5.else return 4;
5.else return 4;
}
If line 3 is incorrectly implemented as “return 7” instead of “return 2”, then p(1,1,1,1,0) =
3行目が “return 2” ではなく “return 7” と誤って実装されている場合、p(1,1,1,1,0) =
1 because “a && b” evaluates to 1, but p(0,1,1,1,0) will detect the error. A complete 3-way covering test set will detect the error because it must include at least one test with values 0,1,1,1,. and one with 1,0,1,1,. . Figure 31 shows tests for this example for t = 2, 3, and 4. Failing tests are underlined.
1となります。これは「a && b」の評価結果が1だからです。しかし、p(0,1,1,1,0)ではエラーが検出されます。完全な3-wayカバリングテストセットは、値が0,1,1,1,.となるテストと、1,0,1,1,.となるテストを少なくとも一つずつ含むため、このエラーを検出します。図31はt = 2、3、4の場合のこの例のテストを示します。失敗したテストには下線を付しています。
A 2-way test may detect the error, since “\(\mathrm{c} \mathbin{\&\&} \mathrm{d}\)” is the condition necessary, but this will only occur if line 3 is reached, which requires either \(\mathrm{a}=0\) or \(\mathrm{b}=0\). In the example test set this occurs with the second test. So in this case, a full 2-way test set has detected the error, and the heuristics above for 2-way combinations will find that tests with \(c=1\) and \(d=1\) occur in both \(P\) and \(F\). In this case, debugging may identify \(\mathrm{c}=1\), \(\mathrm{d}=1\) as a combination that triggers the failure, but automated analysis using the heuristics will find two 3-way combinations that occur in failing tests but not passing tests: \(\mathrm{a}=0\), \(\mathrm{c}=1\), \(\mathrm{d}=1\) and \(\mathrm{b}=0\), \(\mathrm{c}=1\), \(\mathrm{d}=1\). As Figure 32 illustrates, in most cases we will find more than one combination identified as possible causes of failure.
2-wayテストはこのエラーを検出できる可能性があります。必要な条件は「\(\mathrm{c} \mathbin{\&\&} \mathrm{d}\)」だからです。ただし、これが起こるのは3行目に到達した場合だけであり、それには\(\mathrm{a}=0\)または\(\mathrm{b}=0\)のいずれかが必要です。例のテストセットでは、2番目のテストでこれが起こります。したがってこの場合、完全な2-wayテストセットはエラーを検出しており、2-way組合せに対する上記のヒューリスティックによって、\(c=1\)かつ\(d=1\)のテストが\(P\)と\(F\)の両方に現れることが分かります。この場合、デバッグでは\(\mathrm{c}=1\)、\(\mathrm{d}=1\)が失敗を引き起こす組合せとして特定されるかもしれませんが、ヒューリスティックを用いた自動分析では、失敗したテストには現れ、成功したテストには現れない3-way組合せが2つ見つかります。\(\mathrm{a}=0\)、\(\mathrm{c}=1\)、\(\mathrm{d}=1\)と、\(\mathrm{b}=0\)、\(\mathrm{c}=1\)、\(\mathrm{d}=1\)です。図32が示すように、ほとんどの場合、失敗の原因の候補として複数の組合せが特定されます。
| 1 way tests | 2 way tests | 3 way tests | 4 way tests |
|---|---|---|---|
| 0,0,0,0,0 1,1,1,1,1 | 0,0,0,0,0 0,1,1,1,1 1,0,1,0,1 1,1,0,1,0 1,1,1,0,0 1,0,0,1,1 | 0,0,0,0,0 0,0,1,1,1 0,1,0,1,0 0,1,1,0,1 1,0,0,1,1 1,0,1,0,0 1,1,0,0,1 1,1,1,1,0 0,0,1,1,0 1,1,0,0,0 0,0,0,0,1 1,1,1,1,1 0,1,1,1,0 | 0,0,0,0,0 0,0,0,1,1 0,0,1,0,1 0,0,1,1,0 0,1,0,0,1 0,1,0,1,0 0,1,1,0,0 0,1,1,1,1 1,0,0,0,1 1,0,0,1,0 1,0,1,0,0 1,0,1,1,1 1,1,0,0,0 1,1,0,1,1 1,1,1,0,1 1,1,1,1,0 |
| 1-wayテスト | 2-wayテスト | 3-wayテスト | 4-wayテスト |
|---|---|---|---|
| 0,0,0,0,0 1,1,1,1,1 | 0,0,0,0,0 0,1,1,1,1 1,0,1,0,1 1,1,0,1,0 1,1,1,0,0 1,0,0,1,1 | 0,0,0,0,0 0,0,1,1,1 0,1,0,1,0 0,1,1,0,1 1,0,0,1,1 1,0,1,0,0 1,1,0,0,1 1,1,1,1,0 0,0,1,1,0 1,1,0,0,0 0,0,0,0,1 1,1,1,1,1 0,1,1,1,0 | 0,0,0,0,0 0,0,0,1,1 0,0,1,0,1 0,0,1,1,0 0,1,0,0,1 0,1,0,1,0 0,1,1,0,0 0,1,1,1,1 1,0,0,0,1 1,0,0,1,0 1,0,1,0,0 1,0,1,1,1 1,1,0,0,0 1,1,0,1,1 1,1,1,0,1 1,1,1,1,0 |
Figure 31. Tests for fault location example.
図31. 故障箇所特定の例に対するテスト。
The heuristics above can be applied to combinations in the failed tests to identify possible failure-triggering combinations, shown in Figure 32.
上記のヒューリスティックを失敗したテスト内の組合せに適用すると、図32に示すように失敗誘発の可能性がある組合せを特定できます。
•The 1-way tests do not detect any failures, but the 2-way tests do, so t=2 is a lower bound for the interaction level needed to detect a failure.
•1-wayテストでは失敗は検出されませんが、2-wayテストでは検出されます。したがって、失敗を検出するために必要な相互作用レベルの下限はt=2です。
• The value dependence rule applies to combination “\(\mathtt{be}\)” – since all four possible values for this combination occur in failing tests, failure must be independent of combination \(\mathtt{be}\). In other words, we do not consider the pair \(\mathrm{be}\) to be a cause of failure because it does not matter what value this pair has. Every test must have some value for these parameters.
• 値への依存性の規則は組合せ「\(\mathtt{be}\)」に適用されます。この組合せで可能な4つの値がすべて失敗したテストに現れるので、失敗は組合せ\(\mathtt{be}\)に依存しないはずです。言い換えれば、組\(\mathrm{be}\)がどの値をとるかは関係しないので、この組を失敗の原因とはみなしません。どのテストも、これらのパラメータに何らかの値を持たなければなりません。
| t=2 | ab 01 00 10 | ac 01 11 | ad 01 11 | ae 01 00 11 | bc 11 01 | bd 11 01 | be 11 01 00 10 | cd 11 | ce 11 10 | de 11 10 |
|---|---|---|---|---|---|---|---|---|---|---|
| t=3 | abc 011 001 101 | abd 011 001 101 | abe 011 001 000 101 010 | acd 011 111 | ace 011 010 111 | ade 011 010 111 | bcd 111 011 | bce 111 011 010 110 | bde 111 011 010 110 | cde 111 110 |
| t=4 | abcd 0111 0011 1011 | abce 0111 0011 0010 1011 0110 | abde 0111 0011 0010 1011 0110 | bcde 1111 0111 0110 1110 |
Figure 32. Combinations in failing tests.
図32. 失敗テストに含まれる組合せ。
•The elimination rule can be applied to determine that there are no 1-way or 2-way combinations that do not appear in both passing and failing tests. Results for 3-way and 4-way combinations are shown in Figure 33. These results were produced by an analysis tool which outputs in the format <test number>:<t level> <parameter numbers> = <parameter values>. Two different 3-way combinations are identified: a=0, c=1, d=1 and b=0, c=1, d=1. A large number of 4-way combinations are also identified, but we can use the interaction continuity rule to show that one of the two 3-way combinations occurs in all of the failing 4-way failing tests. Therefore we can conclude that covering all 3-way parameter interactions would detect the error.
•除去規則を適用すると、合格したテストと失敗したテストの両方に現れない1項または2項の組合せは存在しないことがわかります。3項および4項の組合せの結果を図33に示します。これらの結果は、<test number>:<t level> <parameter numbers> = <parameter values> の形式で出力する分析ツールによって生成されました。2つの異なる3項組合せ a=0, c=1, d=1 と b=0, c=1, d=1 が特定されます。多数の4項組合せも特定されますが、相互作用連続性規則を用いれば、2つの3項組合せのいずれかが、失敗した4項テストのすべてに現れることを示せます。したがって、すべての3項パラメータ相互作用をカバーすればこのエラーを検出できると結論づけられます。
| 1 :3way 0,2,3 = 0,1,1 2 :3way 0,2,3 = 0,1,1 3 :3way 0,2,3 = 0,1,1 4 :3way 0,2,3 = 0,1,1 1 :3way 1,2,3 = 0,1,1 2 :3way 1,2,3 = 0,1,1 5 :3way 1,2,3 = 0,1,1 | 1 :4way 0,1,2,3 = 0,0,1,1 2 :4way 0,1,2,3 = 0,0,1,1 3 :4way 0,1,2,3 = 0,1,1,1 4 :4way 0,1,2,3 = 0,1,1,1 5 :4way 0,1,2,3 = 1,0,1,1 1 :4way 0,1,2,4 = 0,0,1,0 1 :4way 0,1,3,4 = 0,0,1,0 4 :4way 0,1,3,4 = 0,1,1,1 1 :4way 0,2,3,4 = 0,1,1,0 2 :4way 0,2,3,4 = 0,1,1,1 3 :4way 0,2,3,4 = 0,1,1,0 4 :4way 0,2,3,4 = 0,1,1,1 1 :4way 1,2,3,4 = 0,1,1,0 2 :4way 1,2,3,4 = 0,1,1,1 5 :4way 1,2,3,4 = 0,1,1,1 |
| 1 :3way 0,2,3 = 0,1,1 2 :3way 0,2,3 = 0,1,1 3 :3way 0,2,3 = 0,1,1 4 :3way 0,2,3 = 0,1,1 1 :3way 1,2,3 = 0,1,1 2 :3way 1,2,3 = 0,1,1 5 :3way 1,2,3 = 0,1,1 | 1 :4way 0,1,2,3 = 0,0,1,1 2 :4way 0,1,2,3 = 0,0,1,1 3 :4way 0,1,2,3 = 0,1,1,1 4 :4way 0,1,2,3 = 0,1,1,1 5 :4way 0,1,2,3 = 1,0,1,1 1 :4way 0,1,2,4 = 0,0,1,0 1 :4way 0,1,3,4 = 0,0,1,0 4 :4way 0,1,3,4 = 0,1,1,1 1 :4way 0,2,3,4 = 0,1,1,0 2 :4way 0,2,3,4 = 0,1,1,1 3 :4way 0,2,3,4 = 0,1,1,0 4 :4way 0,2,3,4 = 0,1,1,1 1 :4way 1,2,3,4 = 0,1,1,0 2 :4way 1,2,3,4 = 0,1,1,1 5 :4way 1,2,3,4 = 0,1,1,1 |
Figure 33. 3-way and 4-way combinations in \(F \setminus P\)
図33. \(F \setminus P\) 中の3項および4項の組合せ
Figure 33. 3-way and 4-way combinations in \(F \setminus P\)
図33. \(F \setminus P\) に含まれる3-wayおよび4-way組合せ
The situation is more complex with continuous variables. If, for example, a failure-related branch is taken any time \(x > 100\), \(y = 3\), \(z < 1000\), there may be many combinations implicated in the failure. Analysis will show that \([\mathrm{x} = 200, \mathrm{y} = 3, \mathrm{z} = 120]\), \([\mathrm{x} = 201, \mathrm{y} = 3, \mathrm{z} = 119]\), \([\mathrm{x} = 999, \mathrm{y} = 3, \mathrm{z} = 999]\), \([\mathrm{x} = 101, \mathrm{y} = 3, \mathrm{z} = 0]\), \([\mathrm{x} = 200, \mathrm{y} = 3, \mathrm{z} = 0]\) are all combinations that trigger the failure. With more than three input parameters, there may be dozens or hundreds of failure-triggering combinations, even though there is most likely a single point in the code that is in error.
連続変数では状況がさらに複雑になります。たとえば、\(x > 100\)、\(y = 3\)、\(z < 1000\)のときは常に失敗に関係する分岐が実行されるとすると、失敗に関与する組合せが多数存在しうる。分析すると、\([\mathrm{x} = 200, \mathrm{y} = 3, \mathrm{z} = 120]\)、\([\mathrm{x} = 201, \mathrm{y} = 3, \mathrm{z} = 119]\)、\([\mathrm{x} = 999, \mathrm{y} = 3, \mathrm{z} = 999]\)、\([\mathrm{x} = 101, \mathrm{y} = 3, \mathrm{z} = 0]\)、\([\mathrm{x} = 200, \mathrm{y} = 3, \mathrm{z} = 0]\)がいずれも失敗を引き起こす組合せであることが分かります。入力パラメータが3つより多い場合、誤りのあるコード上の箇所はおそらく1か所だけであっても、失敗を引き起こす組合せは数十から数百に及ぶことがあります。
10.2 Cost and Practical Considerations
10.2 コストと実務上の考慮事項
As shown in the example above, it is a non-trivial matter to determine the failure-triggering combination(s) from test results alone. When source code is available, the methods described in this section are probably unnecessary, and can be replaced with conventional debugging techniques. In black-box testing situations where there is no source code, these methods may be useful in narrowing the search for failure-triggering combinations. Tools to implement these methods have been developed and are available from the ACTS project site.
上の例が示すように、テスト結果だけから失敗誘発組合せを特定するのは容易ではありません。ソースコードが利用できる場合、この節で説明した方法はおそらく不要であり、従来のデバッグ手法で置き換えられます。ソースコードがないブラックボックステストの状況では、これらの方法が失敗誘発組合せの探索範囲を絞り込むのに役立つことがあります。これらの方法を実装するツールは開発済みであり、ACTSプロジェクトのサイトから入手できます。
10.3 Chapter Summary
10.3 本章のまとめ
When source code is available, the best way to identify the cause of a failure is with conventional debugging techniques, since the error must be fixed in code anyway. With pure black-box testing and no access to source code, the heuristics discussed in this chapter may help to narrow down possible causes. Usually there will be many combinations identified as possible causes, so substantial additional testing may be needed to determine the exact cause.
ソースコードが利用できる場合、失敗の原因を特定する最善の方法は従来のデバッグ手法です。いずれにせよエラーはコード上で修正しなければならないからです。ソースコードにアクセスできない純粋なブラックボックステストでは、本章で述べたヒューリスティックが原因の候補を絞り込むのに役立つことがあります。通常は多くの組合せが原因の候補として特定されるので、正確な原因を突き止めるには相当量の追加テストが必要になることがあります。
Appendix A – MATHEMATICS REVIEW
附属書A – 数学の復習
This appendix reviews a few basic facts of combinatorics, regular expressions, and mathematical logic that are necessary to understand the concepts in this publication.
本附属書では、本刊行物の概念を理解するために必要な、組合せ論、正規表現、数理論理学の基本的な事実を復習します。
Combinatorics
組合せ論
Permutations and Combinations
順列と組合せ
For \(n\) variables, there are \(n!\) permutations and \(\binom{n}{t} = \frac{n!}{t!(n-t)!}\) (“\(n\) choose \(t\)”) combinations of \(t\) variables, also written for convenience as \(\mathrm{C}(n, t)\). To exercise all of the \(t\)-way combinations of inputs to a program, we need to cover all \(t\)-way combinations of variable values, and each combination of \(t\) values can have \(v^t\) configurations, where \(v\) is the number of values per variable. Thus the total number of combinations instantiated with values that must be covered is
\(n\)個の変数には、\(n!\)通りの順列と、\(t\)個の変数の\(\binom{n}{t} = \frac{n!}{t!(n-t)!}\)(「\(n\)チョイス\(t\)」)通りの組合せがあり、便宜上\(\mathrm{C}(n, t)\)とも書きます。プログラムへの入力の\(t\)-way組合せをすべて実行するには、変数値の\(t\)-way組合せをすべて網羅する必要があり、\(t\)個の値の各組合せには\(v^t\)通りの構成がありうます。ここで\(v\)は変数1つあたりの値の個数です。したがって、網羅しなければならない、値を割り当てた組合せの総数は次のとおりです。
Fortunately, each test covers \(\mathrm{C}(n, t)\) combination configurations. This fact is the source of combinatorial testing’s power. For example, with 34 binary variables, we would need \(2^{34} = 1.7 * 10^{10}\) tests to cover all possible configurations, but with only 33 tests we can cover all 3-way combinations of these 34 variables. This happens because each test covers \(\mathrm{C}(34, 3)\) combinations.
幸い、各テストは\(\mathrm{C}(n, t)\)個の組合せ設定を網羅します。この性質が組合せテストの力の源です。たとえば、34個の二値変数では、すべての設定を網羅するには\(2^{34} = 1.7 * 10^{10}\)件のテストが必要ですが、33件のテストだけで、これら34個の変数の3-way組合せをすべて網羅できます。これは、各テストが\(\mathrm{C}(34, 3)\)個の組合せを網羅するためです。
Example. If we have five binary variables, \(a\), \(b\), \(c\), \(d\), and \(e\), then expression (1) says we will need to cover \(2^3 * \mathrm{C}(5, 3) = 8*10 = 80\) configurations. For 3-way combinatorial testing, we will need to take all 3-variable combinations, of which there are 10:
例:二値変数\(a\)、\(b\)、\(c\)、\(d\)、\(e\)が5個あるとします。式(1)によれば、\(2^3 * \mathrm{C}(5, 3) = 8*10 = 80\)通りの設定を網羅する必要があります。3-way組合せテストでは、3変数の組合せをすべて扱う必要があり、それは次の10個である:
abc, abd, abe, acd, ace, ade, bcd, bce, bde, cde
abc, abd, abe, acd, ace, ade, bcd, bce, bde, cde
Each of these will need to be instantiated with all 8 possible configurations of three binary variables:
これらはそれぞれ、3つの2値変数の8通りの構成すべてで具体化する必要があります。
000, 001, 010, 011, 100, 101, 110, 111
000, 001, 010, 011, 100, 101, 110, 111
The test [0 1 0 0 1] covers the following \(\mathrm{C}(5, 3) = 10\) configurations:
テスト[0 1 0 0 1]は、次の\(\mathrm{C}(5, 3) = 10\)通りの設定を網羅する:
abc abd abe acd ace ade bcd bce bde cde 010 000 011 001 001 001 100 101 101 001
abc abd abe acd ace ade bcd bce bde cde 010 000 011 001 001 001 100 101 101 001
Orthogonal Arrays
直交配列
Many software testing problems can be solved with an orthogonal array, a structure that has been used for combinatorial testing in fields other than software for decades. An orthogonal array, OAλ (N;t,k,v) is an N x k array. In every N x t subarray, each t-tuple occurs exactly λ times. We refer to t as the strength of the coverage of interactions, k as the number of parameters or components (degree), and v as the number of possible values for each parameter or component (order).
多くのソフトウェアテストの問題は、直交配列で解決できます。これは、ソフトウェア以外の分野で組合せテストのために数十年にわたり使われてきた構造です。直交配列 OAλ (N;t,k,v) は、N x kの配列です。N x tのすべての部分配列において、各t組はちょうどλ回現れます。tを相互作用のカバレッジの強度、kをパラメータまたは構成要素の数(次数)、vを各パラメータまたは構成要素がとりうる値の数(位数)と呼びます。
Example. Suppose we have a system with three on-off switches, controlled by an embedded processor. The following table tests all pairs of switch settings exactly once each. Thus \(t = 2\), \(\lambda = 1\), \(v = 2\). Note that there are \(v^t = 2^2\) possible combinations of values for each pair: 00, 01, 10, 11. There are \(\mathrm{C}(3,2) = 3\) ways to select switch pairs: (1,2), (1,3), and (2,3), and each test covers three pairs, so the four tests cover a total of 12 combinations which implies that each combination is covered exactly once. As one might suspect, it can be very challenging to fit all combinations to be covered into a set of tests exactly the same number of times.
例:組込みプロセッサで制御するオン・オフスイッチが3つあるシステムを考えます。次の表は、スイッチ設定のすべてのペアをちょうど1回ずつ試験します。したがって\(t = 2\)、\(\lambda = 1\)、\(v = 2\)です。各ペアの値の組合せは\(v^t = 2^2\)通り、すなわち00、01、10、11です。スイッチのペアの選び方は\(\mathrm{C}(3,2) = 3\)通り、すなわち(1,2)、(1,3)、(2,3)であり、各テストは3つのペアを網羅します。したがって4件のテストは合計12個の組合せを網羅し、各組合せがちょうど1回ずつ網羅されることになります。想像されるとおり、網羅すべきすべての組合せを、ちょうど同じ回数ずつテスト集合に収めることは非常に難しい場合があります。
| Test | Sw 1 | Sw 2 | Sw 3 |
|---|---|---|---|
| 1 | 0 | 0 | 0 |
| 2 | 0 | 1 | 1 |
| 3 | 1 | 0 | 1 |
| 4 | 1 | 1 | 0 |
| テスト | スイッチ1 | スイッチ2 | スイッチ3 |
|---|---|---|---|
| 1 | 0 | 0 | 0 |
| 2 | 0 | 1 | 1 |
| 3 | 1 | 0 | 1 |
| 4 | 1 | 1 | 0 |
Covering Arrays
カバリングアレイ
An alternative to an orthogonal array is a set called a covering array, which includes all \(t\)-way combinations of parameter values, for the desired strength \(t\). A covering array, \(\mathit{CA}_{\lambda}(N;t,k,v)\), is an \(N \times k\) array. In every \(N \times t\) subarray, each \(t\)-tuple occurs at least \(\lambda\) times. Note this distinction between covering arrays and orthogonal arrays discussed in the previous section. The covering array relaxes the restriction that each combination is covered exactly the same number of times. Thus covering arrays may result in some test duplication, but they offer the advantage that they can be computed for much larger problems than is possible for orthogonal arrays. Software described elsewhere in this book can efficiently generate covering arrays up to strength \(t = 6\), for a large number of variables.
直交配列に代わるものとして、被覆配列と呼ばれる集合があります。被覆配列は、求める強度\(t\)について、パラメータ値の\(t\)-way組合せをすべて含みます。被覆配列\(\mathit{CA}_{\lambda}(N;t,k,v)\)は\(N \times k\)の配列です。どの\(N \times t\)部分配列においても、各\(t\)タプルは少なくとも\(\lambda\)回出現します。前節で述べた直交配列と被覆配列とのこの違いに注意されました。被覆配列は、各組合せがちょうど同じ回数だけ網羅されるという制約を緩めています。そのため、被覆配列ではテストにいくらか重複が生じることがありますが、直交配列で可能な規模よりはるかに大きな問題に対して計算できるという利点があります。本書の別の箇所で説明するソフトウェアは、多数の変数に対して、強度\(t = 6\)までの被覆配列を効率よく生成できます。
The problems discussed in this publication deal only with the case when \(\lambda = 1\), (i.e. that every \(t\)-tuple must be covered at least once). In software testing, each row of the covering array represents a test, with one column for each parameter that is varied in testing. Collectively, the rows of the array include every \(t\)-way combination of parameter values at least once. For example, Figure 1 shows a covering array that includes all 3-way combinations of binary values for 10 parameters. Each column gives the values for a particular parameter. It can be seen that any three columns in any order contain all eight possible combinations of the parameter values. Collectively, this set of tests will exercise all 3-way combinations of input values in only 13 tests, as compared with 1,024 for exhaustive coverage.
本書で扱う問題は、\(\lambda = 1\)の場合(すなわち、すべての\(t\)タプルを少なくとも1回網羅しなければならない場合)だけです。ソフトウェアテストでは、被覆配列の各行が1つのテストを表し、テストで値を変える各パラメータに1つの列が対応します。配列の行全体として、パラメータ値のすべての\(t\)-way組合せを少なくとも1回含みます。たとえば図1は、10個のパラメータについて2値の3-way組合せをすべて含む被覆配列を示しています。各列は特定のパラメータの値を示します。任意の3列をどの順序で取っても、パラメータ値の可能な8通りの組合せがすべて含まれることが分かります。このテストの集合は全体として、入力値のすべての3-way組合せをわずか13個のテストで実行します。これに対し、全数網羅では1,024個が必要です。
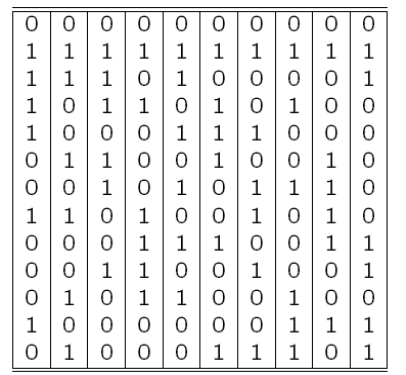
図1. 各パラメーターが2つの値を取る、10パラメーターの3-way被覆配列。0 と 1 を 13 行 10 列に並べた格子で、列の間は縦罫線で区切られている。上の行から順に、各行を左から右へ読むと次のとおりである:0000000000; 1111111111; 1110100001; 1011010100; 1000111000; 0110010010; 0010101110; 1101001010; 0001110011; 0011001001; 0101100100; 1000000111; 0100011101。
Figure 1. 3-way covering array for 10 parameters with 2 values each.
図1. 各パラメーターが2つの値を取る、10パラメーターの3-way被覆配列。
Number of Tests Required
必要なテスト数
The challenge in computing covering arrays is to find the smallest possible array that covers all configurations of \(\mathrm{t}\) variables. If every new test generated covered all previously uncovered combinations, then the number of tests needed would be
被覆配列の計算で課題となるのは、\(\mathrm{t}\)個の変数のすべての構成を網羅する、可能な限り小さい配列を見つけることです。新たに生成する各テストが、それまで網羅されていなかった組合せをすべて網羅するとしたら、必要なテスト数は次のとおりになります。
Since this is not generally possible, the covering array will be significantly larger than \(v^t\), but still a reasonable number for testing. It can be shown that the number of tests in a \(\mathrm{t}\)-way covering array will be proportional to
これは一般には不可能なので、被覆配列は\(v^t\)よりかなり大きくなりますが、それでもテストとして妥当な数に収まります。\(\mathrm{t}\)-way被覆配列のテスト数は次の式に比例することを示せます。
for \(n\) variables with \(v\) values each.
ここで、変数は\(n\)個で、それぞれ\(v\)個の値を取ります。
It’s worth considering the components of this expression to gain a better understanding of what will be required to do combinatorial testing. First, note that the number of tests grows exponentially with the interaction strength \(\mathrm{t}\). The number of tests required for \(t+1\)-way testing will be in the neighborhood of \(v\) times the number required for \(t\)-way testing. The table below shows how \(v^t\), grows for values of \(v\) and \(t\). Although the number of tests required for high-strength combinatorial testing can be very large, with advanced software and cluster processors it is not out of reach.
組合せテストを行うのに何が必要になるかをよりよく理解するために、この式の構成要素を考えてみる価値があります。まず、テスト数は相互作用強度\(\mathrm{t}\)に対して指数関数的に増加することに注意されました。\(t+1\)-wayテストに必要なテスト数は、\(v\)を\(t\)-wayテストに必要な数に掛けた値の近くになります。下の表は、\(v^t\)が\(v\)と\(t\)の値に応じてどのように増加するかを示します。高強度の組合せテストに必要なテスト数は非常に大きくなりうますが、高度なソフトウェアとクラスタプロセッサがあれば手の届かない数ではありません。
| v↓ t→ | 2 | 3 | 4 | 5 | 6 |
|---|---|---|---|---|---|
| 2 | 4 | 8 | 16 | 32 | 64 |
| 4 | 16 | 64 | 256 | 1024 | 4096 |
| 6 | 36 | 216 | 1296 | 7776 | 46656 |
| v↓ t→ | 2 | 3 | 4 | 5 | 6 |
|---|---|---|---|---|---|
| 2 | 4 | 8 | 16 | 32 | 64 |
| 4 | 16 | 64 | 256 | 1024 | 4096 |
| 6 | 36 | 216 | 1296 | 7776 | 46656 |
Table 1. Growth of \(v^t\)
表1. \(v^t\)の増加
Despite the possibly discouraging numbers in the table above, there is some good news. Note that formula (2) grows only logarithmically with the number of variables, n. This is fortunate for software testing. Early applications of combinatorial methods were typically involved with small numbers of variables, such as a few different types of crops or fertilizers, but for software testing, we must deal with tens, or in some cases hundreds of variables.
上の表の数値は悲観的に見えるかもしれませんが、明るい材料もあります。式(2)は、変数の数nに対して対数的にしか増加しない点に注意されました。これはソフトウェアテストにとって好都合です。組合せ手法の初期の応用は、通常、数種類の作物や肥料のような少数の変数を扱うものでしたが、ソフトウェアテストでは、数十、場合によっては数百の変数を扱わなければなりません。
Regular Expressions
正規表現
Regular expressions are formal descriptions of strings of symbols, which may represent text, events, characters, or other objects. They are developed within automata theory and formal languages, where it is shown that there are direct mappings between expressions and automata to process them, and are encountered in many areas within computer science. In combinatorial testing they may be encountered in sequence covering or in processing test input or output. Implementations vary, but standard syntax is explained below.
正規表現は、テキスト、イベント、文字、その他のオブジェクトを表しうる記号列の形式的な記述です。オートマトン理論および形式言語の中で発展したものであり、そこでは、表現とそれを処理するオートマトンとの間に直接の対応があることが示されており、計算機科学の多くの分野で見られます。組合せテストでは、シーケンス被覆、あるいはテスト入力や出力の処理で出会うことがあります。実装は多様ですが、標準的な構文を以下に説明します。
Expression Operators
表現の演算子
Basic elements of regular expressions include:
正規表現の基本要素には次のものがあります。
•| — “or” alternation. Ex: ab|ac matches “ab” or “ac”
•| — 「または」の選択。例:ab|ac は「ab」または「ac」に一致する
•? — 0 or 1 of the preceding element. Ex: ab?c matches “ac” or “abc”
•? — 直前の要素の0回または1回。例:ab?c は「ac」または「abc」に一致する
•* — 0 or more of the preceding element. Ex: ab* matches “a”, “ab”, “abb”, “abbb” etc.
•* — 直前の要素の0回以上。例:ab* は「a」「ab」「abb」「abbb」などに一致する
•+ — 1 or more of the preceding element. Ex: ab+ matches “ab”, “abb”, “abbb” etc.
•+ — 直前の要素の1回以上。例:ab+ は「ab」「abb」「abbb」などに一致する
•() — grouping. Ex: (abc|abcd) matches “abc” or “abcd”
•() — グループ化。例:(abc|abcd) は「abc」または「abcd」に一致する
•. — matches any single character. Ex: a.c matches “abc”, “axc”, “a@c” etc.
•. — 任意の1文字に一致します。例:a.c は「abc」「axc」「a@c」などに一致する
•[ ] — matches any single character within brackets. Ex: [abc] matches “a” or “b” or “c”. A range may also be specified. Ex: [a-z] matches any single lower case character. (This option depends on the character set supported.)
•[ ] — 角括弧内の任意の1文字に一致します。例:[abc] は「a」「b」「c」のいずれかに一致します。範囲を指定することもできます。例:[a-z] は任意の小文字1文字に一致します。(このオプションは、対応する文字集合に依存します。)
•[^ ] — matches any single character that is not contained in the brackets. Ex: [^ab] matches any character except “a” or “b”
•[^ ] — 角括弧内に含まれない任意の1文字に一致します。例:[^ab] は「a」と「b」以外の任意の文字に一致する
•^ — matches start position, i.e., before the first character
•^ — 開始位置、すなわち先頭の文字の前に一致する
•$ — matches end position, i.e., after the last character
•$ — 終了位置、すなわち最後の文字の後に一致する
Combining Operators
演算子の組合せ
The operators above can be combined with symbols to create arbitrarily complex expressions. Examples include:
上記の演算子は、記号と組み合わせて、任意に複雑な表現を作成できます。例には次のものがあります。
•.*a.*b.*c.* — “a” followed by “b” followed by “c” with zero or more symbols prior to “a”, following “c”, or interspersed with the three symbols
•.*a.*b.*c.* — 「a」の次に「b」、その次に「c」が続き、「a」の前、「c」の後、またはこの3つの記号の間に、0個以上の記号が挟まるもの
•a|b* — null or “a” or zero or more occurrences of “b”
•a|b* — 空、または「a」、または「b」の0回以上の出現
•a+ — equivalent to aa*
•a+ — aa*と等価
Many regular expression utilities such as egrep support a broader range of operators and features. Readers should consult documentation for grep, egrep, or other regular expression processors for detailed coverage of the options available on particular tools.
egrepなどの多くの正規表現ユーティリティは、より広範な演算子と機能に対応しています。読者は、特定のツールで利用できるオプションの詳細について、grep、egrep、その他の正規表現プロセッサの文書を参照すべきです。
Appendix B - EMPIRICAL DATA ON SOFTWARE FAILURES
付録B - ソフトウェア障害に関する実証データ
One of the most important questions in software testing is "how much is enough"? For combinatorial testing, this question includes determining the appropriate level of interaction that should be tested. That is, if some failure is triggered only by an unusual combination of more than two values, how many testing combinations are enough to detect all errors? What degree of interaction occurs in real system failures? This section summarizes what is known about these questions based on research by NIST and others [4, 7, 34, 35, 36, 65].
ソフトウェアテストにおける最も重要な問いの1つは、「どれだけやれば十分か」です。組合せテストでは、この問いに、テストすべき相互作用の適切な水準を決めることが含まれます。つまり、ある失敗が2つを超える値の珍しい組合せによってのみ引き起こされるとしたら、すべてのエラーを検出するにはいくつの組合せをテストすれば十分なのか。実際のシステムの失敗では、どの程度の相互作用が生じているのか。本節では、NISTほかによる研究[4, 7, 34, 35, 36, 65]に基づき、これらの問いについて分かっていることをまとめます。
Table 1 below summarizes what we know from empirical studies of a variety of application domains, showing the percentage of failures that are triggered by the interaction of one to six variables. For example, 66% of the medical devices were triggered by a single variable value, and 97% were triggered by either one or two variables interacting. Although certainly not conclusive, the available data suggest that the number of interactions involved in system failures is relatively low, with a maximum from 4 to 6 in the six studies cited below. (Note: TCAS study used seeded errors, all others are "naturally occurring", * = not reported.)
下の表1は、さまざまな応用分野の実証研究から分かっていることをまとめたもので、1個から6個の変数の相互作用によって引き起こされる失敗の割合を示します。たとえば、医療機器では66%が単一の変数の値によって引き起こされ、97%が1個または2個の変数の相互作用によって引き起こされました。決定的とは言えませんが、入手できるデータは、システムの失敗に関与する相互作用の数が比較的少なく、下に挙げる6つの研究では最大でも4から6であることを示唆しています。(注:TCASの研究は埋め込んだエラーを使用しており、その他はすべて「自然に発生した」ものです。* = 報告なし。)
| Vars | Medical Devices | Browser | Server | NASA GSFC | Network Security | TCAS |
|---|---|---|---|---|---|---|
| 1 | 66 | 29 | 42 | 68 | 17 | * |
| 2 | 97 | 76 | 70 | 93 | 62 | 53 |
| 3 | 99 | 95 | 89 | 98 | 87 | 74 |
| 4 | 100 | 97 | 96 | 100 | 98 | 89 |
| 5 | 99 | 96 | 100 | 100 | ||
| 6 | 100 | 100 |
| 変数 | 医療機器 | ブラウザー | サーバー | NASA GSFC | ネットワークセキュリティ | TCAS |
|---|---|---|---|---|---|---|
| 1 | 66 | 29 | 42 | 68 | 17 | * |
| 2 | 97 | 76 | 70 | 93 | 62 | 53 |
| 3 | 99 | 95 | 89 | 98 | 87 | 74 |
| 4 | 100 | 97 | 96 | 100 | 98 | 89 |
| 5 | 99 | 96 | 100 | 100 | ||
| 6 | 100 | 100 |
Table 1. Number of variables involved in triggering software failures
表1. ソフトウェア障害を引き起こすことに関与した変数の数
| System | System type | Release stage | Size (LOC) |
|---|---|---|---|
| Medical Devices | Embedded | Fielded products | 103 – 104 (varies) |
| Browser | Web browser | Development/ beta release | approx. 2 x 10⁵ |
| Server | HTTP server | Development/ beta release | approx. 105 |
| NASA database | Distributed scientific database | Development, integration test | approx. 105 |
| Network security | Network protocols | Fielded products | 103 – 105 (varies) |
| システム | システムの種類 | リリース段階 | 規模(LOC) |
|---|---|---|---|
| 医療機器 | 組込み | 出荷済み製品 | 103 – 104(さまざま) |
| ブラウザー | Webブラウザー | 開発中/ベータリリース | 約2 x 10⁵ |
| サーバー | HTTPサーバー | 開発中/ベータリリース | 約105 |
| NASAデータベース | 分散科学データベース | 開発、統合テスト | 約105 |
| ネットワークセキュリティ | ネットワークプロトコル | 出荷済み製品 | 103 – 105(さまざま) |
Table 2. System characteristics
表2. システムの特性
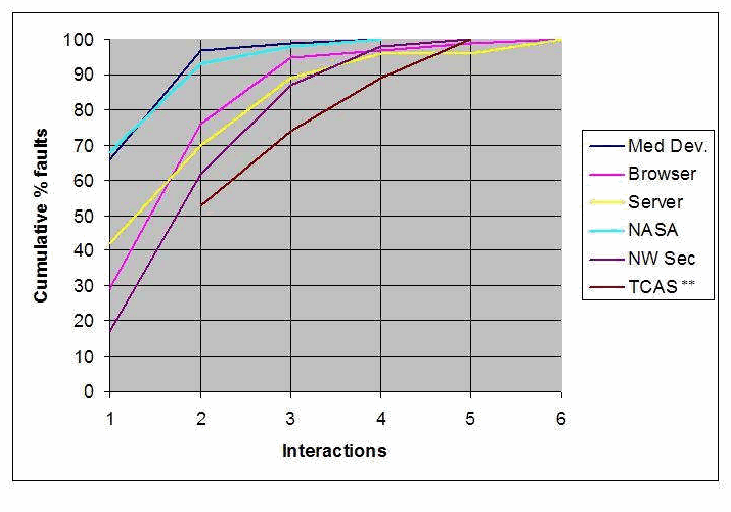
図1. t-way相互作用によって引き起こされた障害の累積割合。灰色の格子上の折れ線グラフである。縦軸は Cumulative % faults(障害の累積割合 %)で 0 から 100 まで 10 刻み、横軸は Interactions(相互作用)で 1 から 6。凡例には Med Dev.、Browser、Server、NASA、NW Sec、TCAS ** の 6 本の線が並ぶ。どの線も 100% へ向かって上がる。相互作用 1 では Med Dev. と NASA が約 66〜67%、Server が約 42%、Browser が約 29%、NW Sec が約 17% から始まり、TCAS の線は相互作用 2 の約 53% から始まる。Med Dev. と NASA は相互作用 2 で 90% を超え、Browser、Server、NW Sec は相互作用 3 で約 87〜95% に達する。TCAS は相互作用 3 で約 74%、4 で約 89%、5 で 100% に達する。
Figure 1. Cumulative percentage of failures triggered by t-way interactions.
図1. t-way相互作用によって引き起こされた障害の累積割合。
We have also investigated a particular class of vulnerabilities, denial-of-serivce, using reports from the National Vulnerability Database (NVD), a publicly available repository of data on all publicly reported software security vulnerabilities. NVD can be queried for fine-granularity reports on vulnerabilities. Data from 3,045 denial-of service vulnerabilities have the distribution shown in Table 3. We present this data separately from that above because it covers only one particular kind of failure, rather than data on any failures occurring in a particular program as shown in Figure 1.
また、National Vulnerability Database(NVD)の報告を用いて、サービス拒否という特定の脆弱性クラスも調査しました。NVDは、一般公開されたソフトウェアセキュリティ脆弱性の全報告を収録する、一般公開のデータリポジトリです。NVDでは脆弱性に関する詳細な報告を検索できます。サービス拒否脆弱性3,045件のデータは、表3に示す分布となりました。これは特定のプログラムで発生するすべての障害のデータを示す上記の図1とは異なり、特定の種類の障害のみを対象としているため、上記のデータとは分けて示します。
| Vars | NVD cumulative % |
|---|---|
| 1 | 93% |
| 2 | 99% |
| 3 | 100% |
| 4 | 100% |
| 5 | 100% |
| 6 | 100% |
| 変数 | NVD累積% |
|---|---|
| 1 | 93% |
| 2 | 99% |
| 3 | 100% |
| 4 | 100% |
| 5 | 100% |
| 6 | 100% |
Table 3. Cumulative percentage of denial-of-service vulnerabilities triggered by t-way interactions.
表3. t-way相互作用によって引き起こされたサービス拒否脆弱性の累積割合。
Why do the failure detection curves look this way? That is, why does the error rate tail off so rapidly with more variables interacting? One possibility is that there are simply few complex interactions in branching points in software. If few branches involve 4-way, 5-way, or 6-way interactions among variables, then this degree of interaction could be rare for failures as well. The table below (Table 4 and Fig. 2) gives the number and percentage of branches in avionics code triggered by one to 19 variables. This distribution was developed by analyzing data in a report on the use of MCDC testing in avionics software [16], which contains 20,256 logic expressions in five different airborne systems in two different airplane models. The table below includes all 7,685 expressions from if and while statements; expressions from assignment (:=) statements were excluded.
障害検出曲線がこのような形になるのはなぜか。つまり、相互作用する変数が増えるとエラー率が急速に低下するのはなぜか。考えられる理由の1つは、ソフトウェアの分岐点に複雑な相互作用がほとんどないことです。変数間の4-way、5-way、6-way相互作用を含む分岐が少なければ、この程度の相互作用が障害を引き起こすこともまれである可能性があります。下の表(表4および図2)は、航空電子機器コードにおいて1~19個の変数によって実行される分岐の数と割合を示します。この分布は、航空電子機器ソフトウェアのMCDC試験利用に関する報告書 [16] のデータを分析して作成されました。同報告書には、2種類の航空機モデルに搭載された5つの異なるシステムにおける20,256個の論理式が含まれます。下の表にはif文およびwhile文に含まれる式7,685個すべてを含め、代入(:=)文の式は除外しました。
Table 4. Number of variables in avionics software branches
表4. 航空電子機器ソフトウェアの分岐に含まれる変数の数
| Vars | Count | Pct | Cumulative |
|---|---|---|---|
| 1 | 5691 | 74.1% | 74.1% |
| 2 | 1509 | 19.6% | 93.7% |
| 3 | 344 | 4.5% | 98.2% |
| 4 | 91 | 1.2% | 99.3% |
| 5 | 23 | 0.3% | 99.6% |
| 6 | 8 | 0.1% | 99.8% |
| 7 | 6 | 0.1% | 99.8% |
| 8 | 8 | 0.1% | 99.9% |
| 9 | 3 | 0.0% | 100.0% |
| 15 | 1 | 0.0% | 100.0% |
| 19 | 1 | 0.0% | 100.0% |
| 変数 | 件数 | 割合 | 累積 |
|---|---|---|---|
| 1 | 5691 | 74.1% | 74.1% |
| 2 | 1509 | 19.6% | 93.7% |
| 3 | 344 | 4.5% | 98.2% |
| 4 | 91 | 1.2% | 99.3% |
| 5 | 23 | 0.3% | 99.6% |
| 6 | 8 | 0.1% | 99.8% |
| 7 | 6 | 0.1% | 99.8% |
| 8 | 8 | 0.1% | 99.9% |
| 9 | 3 | 0.0% | 100.0% |
| 15 | 1 | 0.0% | 100.0% |
| 19 | 1 | 0.0% | 100.0% |
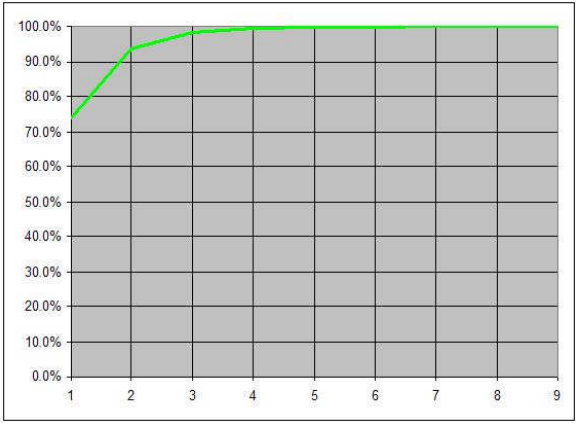
図2. n個の変数を含む分岐の累積割合。灰色の格子上に緑色の線が 1 本だけある折れ線グラフである。縦軸は 0.0% から 100.0% まで 10% 刻み、横軸は軸名のない 1 から 9。線は 1 で約 74% から始まり、2 で約 94%、3 で約 98% に上がり、4 から 9 までは 100% 近くにとどまる。
Figure 2. Cumulative percentage of branches containing n variables.
図2. n個の変数を含む分岐の累積割合。
As shown in Fig. 2, most branching statement expressions are simple, with over 70% containing only a single variable. Superimposing the curve from Fig. 2 on Fig. 1, we see (Fig. 3) that most failures are triggered by more complex interactions among variables. It is interesting that the NASA distributed database failures, from development-phase software bug reports, have a distribution similar to expressions in branching statements. This distribution may be because this was development-phase rather than fielded software like all other types reported in Fig. 1. As failures are removed, the remaining failures may be harder to find because they require the interaction of more variables. Thus testing and use may push the curve down and to the right.
図2に示すように、分岐文の式の大半は単純であり、70%を超える式が単一の変数しか含みません。図2の曲線を図1に重ねると、ほとんどの障害は変数間のより複雑な相互作用によって引き起こされることが分かります(図3)。興味深いことに、開発段階のソフトウェアのバグ報告に基づくNASA分散データベースの障害は、分岐文の式と同様の分布を示します。この分布になったのは、図1に報告された他のすべての種類のシステムのような運用中のソフトウェアではなく、開発段階のソフトウェアを対象としたためかもしれません。障害が取り除かれるにつれ、残った障害はより多くの変数の相互作用を必要とするため、発見が難しくなる可能性があります。このように、試験と使用によって曲線が右下方向に移動することがあります。
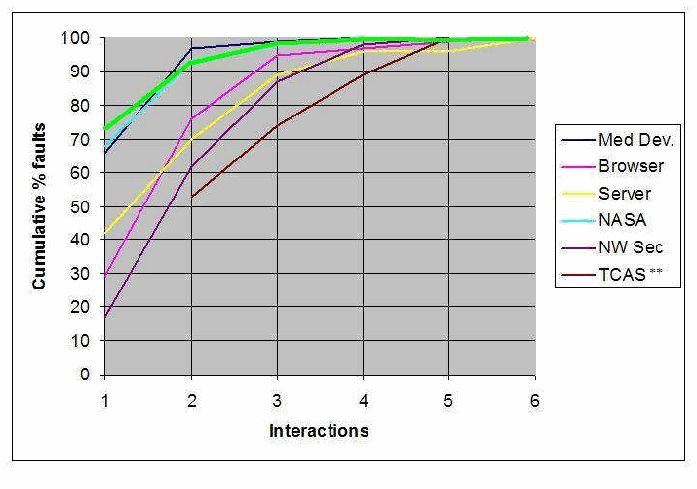
図3. 分岐の分布(緑色)を図1に重ねたもの。図1の折れ線グラフ(縦軸 Cumulative % faults 0〜100、横軸 Interactions 1〜6、凡例 Med Dev.、Browser、Server、NASA、NW Sec、TCAS **)に、凡例に無い太い緑色の線を加えたものである。緑色の線は 1 で約 73% から始まり、2 で約 93%、3 で約 98% を通り、4 から 6 までは 100% 近くを進み、Med Dev. と NASA の線に近い。
Figure 3. Branch distribution (green) superimposed on Fig. 1.
図3. 分岐の分布(緑色)を図1に重ねたもの。
Appendix C - TOOLS FOR COMBINATORIAL TESTING
付録C - 組合せテスト用ツール
A variety of software tools are available to assist with combinatorial testing projects. Here we summarize those available from the NIST ACTS project. The ACTS covering array generator is generally faster and produces smaller test arrays than others, based on comparisons we have done in 2009. The other tools, to the best of our knowledge, have functions that are not available elsewhere.
組合せテストプロジェクトを支援するさまざまなソフトウェアツールが利用できます。ここではNIST ACTSプロジェクトで提供されるツールを要約します。2009年に実施した比較に基づくと、ACTS被覆配列生成器は一般に他のツールより高速で、小さいテスト配列を生成します。他のツールには、私たちの知る限り、他では利用できない機能があります。
•ACTS covering array generator – produces compact arrays that will cover 2-way through 6-way combinations. It also supports constraints that can make some values dependent on others, and mixed level covering arrays which offer different strength coverage for subsets of the parameters (e.g., 2-way coverage for one subset but 4-way for another subset of parameters). Output can be exported in a variety of formats, including human-readable, numeric, and spreadsheet. Either “don’t care” or randomized output can be specified for tests that include combinations already fully covered by previous tests.
•ACTS被覆配列生成器 — 2-wayから6-wayまでの組合せを網羅するコンパクトな配列を生成します。また、一部の値を他の値に依存させる制約や、パラメーターの部分集合ごとに異なる強度の網羅率(例: ある部分集合では2-way、別の部分集合では4-way)を提供する混合レベル被覆配列もサポートします。出力は、人間可読形式、数値形式、スプレッドシート形式など、さまざまな形式でエクスポートできます。以前のテストですでに完全に網羅された組合せを含むテストについては、「ドントケア」またはランダム出力を指定できます。
•Coverage measurement tool – produces a comprehensive set of data on the combinatorial coverage of an existing set of tests, as explained in Chapter 6. Output can be generated in spreadsheet format to allow easy processing and graphing.
•網羅率測定ツール — 第6章で説明したように、既存のテスト集合の組合せ網羅率に関する包括的なデータを生成します。容易に処理およびグラフ化できるよう、スプレッドシート形式で出力できます。
•Sequence covering array generator – produces sequence covering arrays as defined in Chapter 5. It includes an option for constraints in the form of prohibited sequences.
•シーケンス被覆配列生成器 — 第5章で定義したシーケンス被覆配列を生成します。禁止シーケンス形式の制約オプションを含みます。
To obtain any of these, see the ACTS web site at csrc.nist.gov/acts.
これらのツールを入手するには、ACTSウェブサイト csrc.nist.gov/acts を参照されました。
Appendix D - REFERENCES
付録D - 参考文献
1.P. Ammann, P.E. Black, Abstracting Formal Specifications to Generate Software Tests via Model Checking, Proc. 18th Digital Avionics Systems Conference, Oct. 1999, IEEE, vol. 2. pp. 10.A.6.1-10
1.原文のみ
2.P. Ammann, J. Offutt, Introduction to Software Testing, Cambridge University Press, New York, 2008.
2.原文のみ
3.J. Bach, P. Shroeder, Pairwise Testing - A Best Practice That Isn't. Proceedings of 22nd Pacific Northwest Software Quality Conference, 2004, pp. 180-196
3.原文のみ
4.L. Baresi, M. Young, Test Oracles, Dept. of Computer and Information Science, Univ. of Oregon, 2001. http://www.cs.uoregon.edu/michal/pubs/oracles.html
4.原文のみ
5.B. Beizer, Software Testing Techniques, Van Nostrand Reinhold, New York, 2nd edition, 1990.
5.原文のみ
6.K. Z. Bell and Mladen A. Vouk. On effectiveness of pairwise methodology for testing network-centric software. Proceedings of the ITI Third IEEE International Conference on Information & Communications Technology, pages 221–235, Cairo, Egypt, December 2005.
6.原文のみ
7.K.Z. Bell, Optimizing Effectiveness and Efficiency of Software Testing: a Hybrid Approach, PhD Dissertation, North Carolina State University, 2006.
7.原文のみ
8.P. E. Black, V. Okun, Y. Yesha, "Testing with Model Checkers: Insuring Fault Visibility", WSEAS Trans. Sys., 2 (1): 77-82, Jan. 2003.
8.原文のみ
9.P. E. Black, V. Okun, Y. Yesha, "Mutation Operators for Specfications", Automated Software Engineering, 2000
9.原文のみ
10.B.W. Boehm, Software Engineering Economics, Prentice Hall, 1981.
10.原文のみ
11.R. Bryce, C.J. Colbourn. The Density Algorithm for Pairwise Interaction Testing, Journal of Software Testing, Verification and Reliability, August 2007
11.原文のみ
12.R. Bryce, A. Rajan, M.P.E. Heimdahl, Interaction Testing in Model Based Development: Effect on Model Coverage, IEEE, 13th Asia Pacific Software Engineering Conference (APSEC'06) pp. 259-268.
12.原文のみ
13.R. Bryce, Y. Lei, D.R. Kuhn, R. Kacker, "Combinatorial Testing", Chap. 14, Handbook of Research on Software Engineering and Productivity Technologies: Implications of Globalization, Ramachandran, ed. , IGI Global, 2009.
13.原文のみ
14.K. Burr and W. Young Combinatorial Test Techniques: Table-Based Automation, Test Generation, and Test Coverage, International Conference on Software Testing, Analysis, and Review (STAR), San Diego, CA, October, 1998.
14.原文のみ
15.K. Burroughs, A. Jain, and R. L. Erickson. Improved quality of protocol testing through techniques of experimental design. In Proceedings of the IEEE International Conference on Communications (Supercomm/ICC'94), May 1-5, New Orleans, Louisiana, USA. IEEE, May 1994, pp. 745-752
15.原文のみ
16.J.J. Chilenski, An Investigation of Three Forms of the Modified Condition Decision Coverage (MCDC) Criterion, Report DOT/FAA/AR-01/18, April 2001, 214 pp.
16.原文のみ
17.A. Cimatti, E. Clarke, F. Giunchiglia and M. Roveri. NuSMV: a new symbolic model verifier. In N. Halbwachs and D. Peled, editors. Proceeding of International Conference on Computer-Aided Verification (CAV'99). In Lecture Notes in Computer Science, no. 1633, pp. 495-499, Trento, Italy, July 1999. Springer Verlag.
17.原文のみ
18.E. M. Clarke, K. L. McMillan, S. Campos, and V. Hartonas-Garmhausen. Symbolic model checking. In Rajeev Alur and Thomas A. Henzinger, editors, Proceedings of the Eighth International Conference on Computer Aided Verification CAV, volume 1102 of Lecture Notes in Computer Science, pages 419 422, New Brunswick, NJ, USA, July/August 1996. Springer Verlag.
18.原文のみ
19.M.B. Cohen, J. Snyder, G. Rothermel. Testing Across Configurations: Implications for Combinatorial Testing, Workshop on Advances in Model-based Software Testing, Raleigh, Nov. 2006, pp. 1-9
19.原文のみ
20.D.M. Cohen, S. R. Dalal, J. Parelius, G. C. Patton The Combinatorial Design Approach to Automatic Test Generation, IEEE Software, Vol. 13, No. 5, pp. 83-87, September 1996
20.原文のみ
21.L. Copeland, A Practitioner’s Guide to Software Test Design, Artech House Publishers, Boston, 2004.
21.原文のみ
22.Apilli, B. S., L. Richardson, C. Alexander, Fault-based combinatorial testing of web services. In Proc. 24th ACM SIGPLAN Conference Companion on Object Oriented Programming Systems Languages and Applications (Orlando, October 25 - 29, 2009)
22.原文のみ
23.Dalal, S.R., C.L. Mallows, Factor-covering Designs for Testing Software, Technometrics, v. 40, 1998, pp. 234-243.
23.原文のみ
24.S. Dunietz, W. K. Ehrlich, B. D. Szablak, C. L. Mallows, A. Iannino. Applying design of experiments to software testing, Proceedings of the Intl. Conf. on Software Engineering, (ICSE ’97), 1997, pp. 205-215, New York
24.原文のみ
•25. L. du Bousquet, Y. Ledru, O. Maury, C. Oriat, J.-L. Lanet, A case study in JML-based software validation. Proceedings of 19th Int. IEEE Conf. on Automated Sofware Engineering, pp. 294-297, Linz, Sep. 2004
•25. L. du Bousquet, Y. Ledru, O. Maury, C. Oriat, J.-L. Lanet, A case study in JML-based software validation. Proceedings of 19th Int. IEEE Conf. on Automated Sofware Engineering, pp. 294-297, Linz, Sep. 2004
•26. M. Grindal, J. Offutt, S.F. Andler, Combination Testing Strategies: a Survey, Software Testing, Verification, and Reliability, v. 15, 2005, pp. 167-199.
•26. M. Grindal, J. Offutt, S.F. Andler, Combination Testing Strategies: a Survey, Software Testing, Verification, and Reliability, v. 15, 2005, pp. 167-199.
27.C.A.R. Hoare, “Assertions, a Personal Perspective”, IEEE Annals of the History of Computing, vol. 25, no. 2, pp. 14-25, 2003.
27.原文のみ
•28. R. Kramer, “iContract – The Java Design by Contract Tool”. In Proceedings of TOOLS26: Technology of Object-Oriented Languages and Systems, pp. 295-307, IEEE, 1998.
•28. R. Kramer, “iContract – The Java Design by Contract Tool”. In Proceedings of TOOLS26: Technology of Object-Oriented Languages and Systems, pp. 295-307, IEEE, 1998.
•29. V. Hu, D.R. Kuhn, T. Xie, "Property Verification for Generic Access Control Models", IEEE/IFIP International Symposium on Trust, Security, and Privacy for Pervasive Applications, Shanghai, China, Dec. 17-20, 2008.
•29. V. Hu, D.R. Kuhn, T. Xie, "Property Verification for Generic Access Control Models", IEEE/IFIP International Symposium on Trust, Security, and Privacy for Pervasive Applications, Shanghai, China, Dec. 17-20, 2008.
•30. Institute of Electrical and Electronics Engineers, IEEE Standard Glossary of Software Engineering Terminology, ANSI/IEEE Std. 729-1983.
•30. Institute of Electrical and Electronics Engineers, IEEE Standard Glossary of Software Engineering Terminology, ANSI/IEEE Std. 729-1983.
31.D.R. Kuhn, "Fault Classes and Error Detection Capability of Specification Based Testing," ACM Transactions on Software Engineering and Methodology, Vol. 8, No. 4 (October,1999).
31.原文のみ
•32. R. Kuhn, R. Kacker, Y. Lei, J. Hunter, "Combinatorial Software Testing", IEEE Computer, vol. 42, no. 8 (August 2009).
•32. R. Kuhn, R. Kacker, Y. Lei, J. Hunter, "Combinatorial Software Testing", IEEE Computer, vol. 42, no. 8 (August 2009).
•33. D.R. Kuhn, R. Kacker, Y. Lei, "Automated Combinatorial Test Methods: Beyond Pairwise Testing", Crosstalk, Journal of Defense Software Engineering, vol. 21, no. 6, June 2008
•33. D.R. Kuhn, R. Kacker, Y. Lei, "Automated Combinatorial Test Methods: Beyond Pairwise Testing", Crosstalk, Journal of Defense Software Engineering, vol. 21, no. 6, June 2008
34.D.R. Kuhn and V. Okun, “Pseudo-exhaustive Testing for Software,” Proceedings of 30th NASA/IEEE Software Engineering Workshop, pp. 153-158, 2006
34.原文のみ
35.D.R. Kuhn, M.J. Reilly, An Investigation of the Applicability of Design of Experiments to Software Testing, 27th NASA/IEEE Software Engineering Workshop, NASA Goddard Space Flight Center, 4-6 December, 2002 .
35.原文のみ
•36. D.R. Kuhn, D.R. Wallace, and A. Gallo, “Software Fault Interactions and Implications for Software Testing,” IEEE Transactions on Software Engineering, 30(6): 418-421, 2004
•36. D.R. Kuhn, D.R. Wallace, and A. Gallo, “Software Fault Interactions and Implications for Software Testing,” IEEE Transactions on Software Engineering, 30(6): 418-421, 2004
37.D.R. Kuhn, R. Kacker, Y.Lei, "Random vs. Combinatorial Methods for Discrete Event Simulation of a Grid Computer Network", Proceedings, Mod Sim World 2009, Oct. 14-17 2009, Virginia Beach, pp. 83-88, NASA CP-2010-216205, National Aeronautics and Space Administration.
37.原文のみ
38.D.R. Kuhn, R. Kacker, Y. Lei, "Combinatorial and Random Testing Effectiveness for a Grid Computer Simulator" NIST Tech. Rpt. 24 Oct 2008.
38.原文のみ
39.D.R. Kuhn, J.M. Higdon, Testing Event Sequences, http://csrc.nist.gov/groups/SNS/acts/sequence_cov_arrays.html Oct., 2009.
39.原文のみ
40.D.R. Kuhn, J.M. Higdon, J.F. Lawrence, R. Kacker, Y. Lei, "Combinatorial Methods for Event Sequence Testing", (to appear).
40.原文のみ
41.G. Kundrajavets, N. Nagappan, T. Ball, Assessing the Relationship between Software Assertions and Faults: an Empirical Investigation, Proceedings of 17th International Symposium on Software Reliability Engineering, IEEE, pp. 204-212, Raleigh, 2006.
41.原文のみ
42.G.T. Leavens, A.L. Baker, and C. Ruby. JML: A notation for detailed design. In H. Kilov, B. Rumpe, and I. Simmonds, editors, Behavioral Specifications of Businesses and Systems. Kluwer, 1999
42.原文のみ
43.Y. Lei, R. Kacker, D.R. Kuhn, V. Okun, J. Lawrence, “IPOG/IPOG-D: Efficient Test Generation for Multi-Way Combinatorial Testing”, Software Testing, Verification, and Reliability.
43.原文のみ
44.D.C. Luckham, F.W. von Henke. “Overview of Anna, a Specification Language for Ada”, IEEE Software, vol. 2, no. 2, pp. 9-22, March 1985.
44.原文のみ
45.M. Lyu, ed. Software Reliability Engineering, McGraw Hill, 1996.
45.原文のみ
46.P.J. Maker, GNU Nana – User’s Guide (version 2.4). Technical report, School of Information Technology – Northern Territory Univ., July 1998.
46.原文のみ
47.B.A. Malloy, J.M. Voas, “Programming with Assertions – a Prospectus”, IEEE IT Professional, vol. 6, no. 5, pp. 53-59, Sept./Oct. 2004.
47.原文のみ
48.B. Marick, The Craft of Software Testing, Simon & Schuster, 1995.
48.原文のみ
49.A.P. Mathur, Foundations of Software Testing, Addison-Wesley, New York, 2008.
49.原文のみ
50.J.R. Maximoff, M.D. Trela, D.R. Kuhn, R. Kacker, “A Method for Analyzing System State-space Coverage within a t-Wise Testing Framework”, IEEE International Systems Conference 2010, Apr. 4-11, 2010, San Diego.
50.原文のみ
51.M. Memon and Q. Xie. Studying the fault-detection effectiveness of GUI test cases for rapidly evolving software. IEEE Trans. Softw. Eng., 31(10):884–896, 2005.
51.原文のみ
•52. B. Meyer, Object-Oriented Software Construction, Second Edition, Prentice Hall, 1997, ISBN 0-13-629155-4
•52. B. Meyer, Object-Oriented Software Construction, Second Edition, Prentice Hall, 1997, ISBN 0-13-629155-4
53.G. Myers, The Art of Software Testing, John Wiley and Sons, New York, 1979.
53.原文のみ
54.V. Okun, P. E. Black, “Issues in Software Testing with Model Checkers”, Proceedings of the International Conference on Dependable Systems and Networks (DSN-2003), June 2003
54.原文のみ
•55. V. Okun, "Specification Mutation for Test Generation and Analysis", PhD Dissertation, U of Maryland Baltimore Co., 2004
•55. V. Okun, "Specification Mutation for Test Generation and Analysis", PhD Dissertation, U of Maryland Baltimore Co., 2004
56.Alexander Pretschner, Tejeddine Mouelhi, Yves Le Traon. Model Based Tests for Access Control Policies, 2008 International Conference on Software Testing, Verification, and Validation pp. 338-347
56.原文のみ
•57. D.S. Rosenblum. A Practical Approach to Programming with Assertions, IEEE Trans. on Software Eng., vol. 21, no. 11, pp. 777-793, Jan. 1995.
•57. D.S. Rosenblum. A Practical Approach to Programming with Assertions, IEEE Trans. on Software Eng., vol. 21, no. 11, pp. 777-793, Jan. 1995.
•58. Patrick J. Schroeder, Pankaj Bolaki, and Vijayram Gopu. Comparing the fault detection effectiveness of n-way and random test suites. In Proceedings of the IEEE International Symposium on Empirical Software Engineering, pages 49–59, 2004.
•58. Patrick J. Schroeder, Pankaj Bolaki, and Vijayram Gopu. Comparing the fault detection effectiveness of n-way and random test suites. In Proceedings of the IEEE International Symposium on Empirical Software Engineering, pages 49–59, 2004.
•59. M. Sutton, A. Greene, P. Amini, Fuzzing: Brute Force Vulnerability Discovery, Addison-Wesley, 2007
•59. M. Sutton, A. Greene, P. Amini, Fuzzing: Brute Force Vulnerability Discovery, Addison-Wesley, 2007
•60. J.M. Voas, K.W. Miller, “Putting Assertions in their Place”, Proceedings of International Symposium on Software Reliability Engineering, IEEE, pp. 152-157, 1994.
•60. J.M. Voas, K.W. Miller, “Putting Assertions in their Place”, Proceedings of International Symposium on Software Reliability Engineering, IEEE, pp. 152-157, 1994.
•61. J. Voas, Schatz, M., Schmid, M., "A Testability-based Assertion Placement Tool for Object-Oriented Software," National Institute for Standards and Technology NIST GCR 98-735, 1998.
•61. J. Voas, Schatz, M., Schmid, M., "A Testability-based Assertion Placement Tool for Object-Oriented Software," National Institute for Standards and Technology NIST GCR 98-735, 1998.
62.W. Wang Sampath, S. Yu Lei Kacker, R., An Interaction-Based Test Sequence Generation Approach for Testing Web Applications, High Assurance Systems Engineering Symposium, 2008. HASE 2008. Nanjing, 3-5 Dec. 2008 pp. 209-218.
62.原文のみ
•63. X. Yuan, M.B. Cohen, A. Memon, “Covering Array Sampling of Input Event Sequences for Automated GUI Testing”, November 2007 ASE '07: Proceedings of the 22nd IEEE/ACM Intl. Conf. Automated Software Engineering, pp. 405-408.
•63. X. Yuan, M.B. Cohen, A. Memon, “Covering Array Sampling of Input Event Sequences for Automated GUI Testing”, November 2007 ASE '07: Proceedings of the 22nd IEEE/ACM Intl. Conf. Automated Software Engineering, pp. 405-408.
64.X. Yuan and A. M. Memon. Using GUI run-time state as feedback to generate test cases. In ICSE’07, Proceedings of the 29th International Conference on Software Engineering, pages 396–405, Minneapolis, MN, USA, May 23–25, 2007.
64.原文のみ
65.D.R. Wallace, D.R. Kuhn, Failure Modes in Medical Device Software: an Analysis of 15 Years of Recall Data, International Journal of Reliability, Quality, and Safety Engineering, Vol. 8, No. 4, 2001.
65.原文のみ
66.A.W. Williams, R.L. Probert. A practical strategy for testing pair-wise coverage of network interfaces The Seventh International Symposium on Software Reliability Engineering (ISSRE '96) p. 246
66.原文のみ